Control the market and maximise the ROI of your Marketing and Retail Media actions
Monitor your products and your competitors in real time on any channel. Secure your brand image to 100%, control promotional dynamics and maximise your Retail Media ROI by centralising your own and each channel’s data.
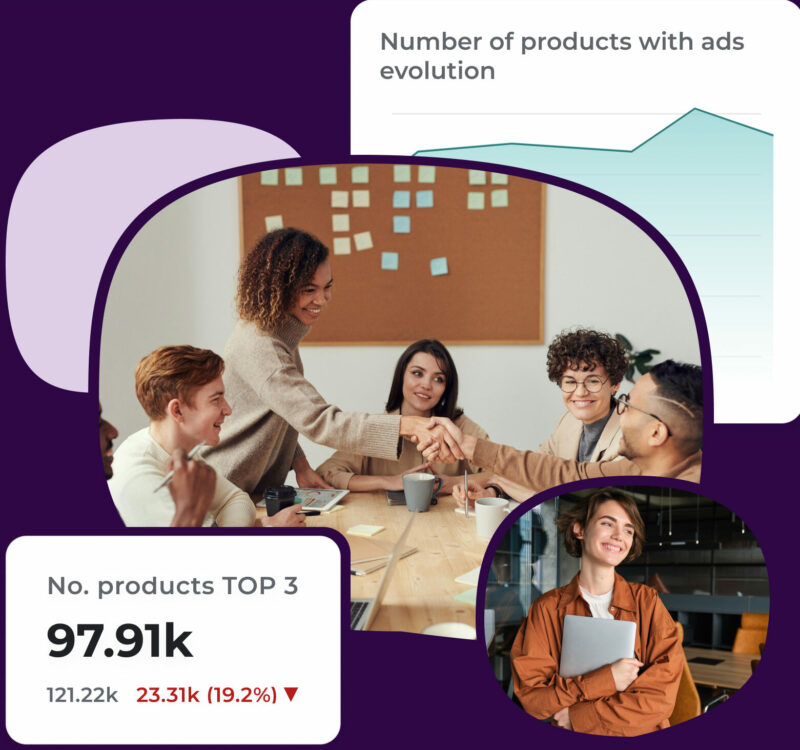

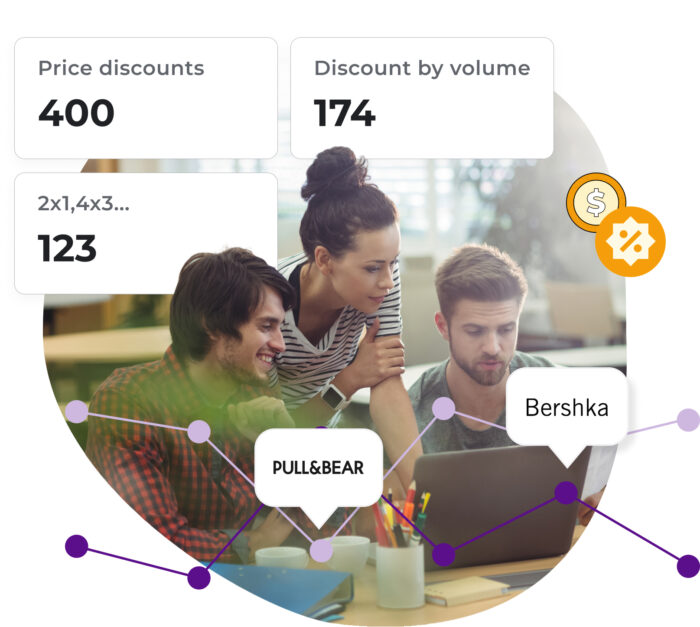
Control prices and promotional dynamics on a daily basis at shop level to maximise sellout
Detect price infringements to avoid channel conflicts or maximise competitiveness.
Optimise your campaigns by ensuring that promotions are implemented correctly at each point of sale.
Increase the efficiency of your strategies by monitoring all your competitors’ promotions and prices.
Check that the agreed promotions are correctly applied from trade marketing.

Increase your Market Share and Share of Shelf by outperforming your direct competitors
Identify opportunities to position your brand above the competition in key queries and categories.
Maximise your ROI by detecting inefficiencies in your campaigns such as stock-outs or missed buy boxes.
Optimise your Retail Media campaigns by analysing performance on specific keywords with all the competitive context on a daily basis.
Integrate retail media performance data from Amazon, Criteo and other sources into a single platform for more agile, higher return decisions.
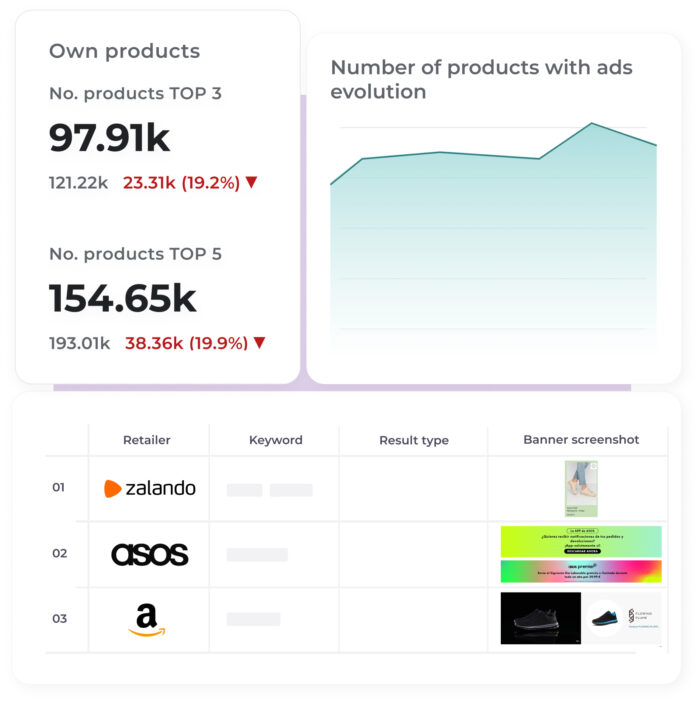
Use our API to get the data you want to integrate with your own tools
Ease the flow of information between platforms to optimise and streamline your processes.
Extract data from flipflow to visualisation tools like Power BI with just a few clicks. Even do it from Excel.
Select the key indicators you wish to query from our configurable report-based API.
Reduce time and errors by implementing automatic processes that update and synchronise your tools in real time.

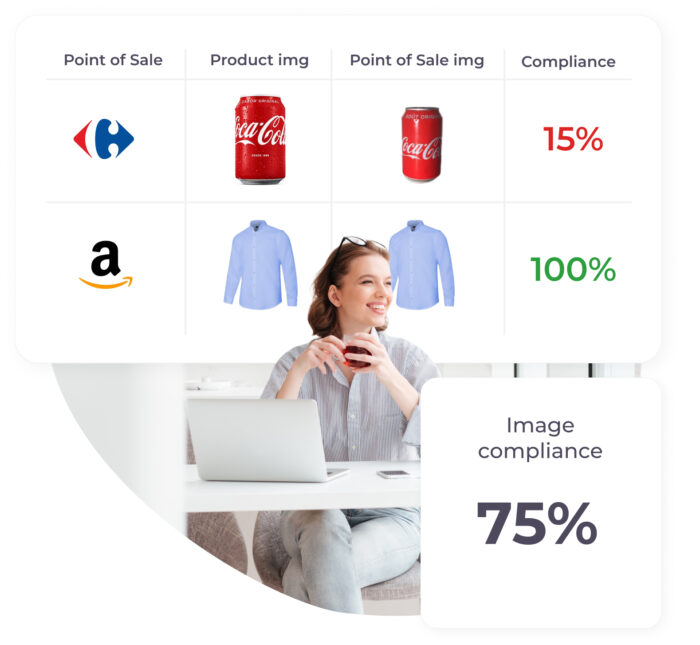
Guarantee compliance and quality of content and images by distributors and sellers
Monitor that your product descriptions, images and content meet your brand standards.
Detect and remove erroneous or unauthorised content on any digital channel.
Protect the perception of your brand from inconsistencies that could affect consumer confidence.
Optimise the right products by opportunity-driven priorities.

Use case: marketing department
Measure and improve brand Share of Shelf
Understanding and optimising your brand’s Share of Shelf is critical to strengthening your brand’s presence in category assortments and search, thereby boosting your competitiveness at the point of sale. With flipflow, brands such as a global leader in nutrition, health and wellness are leveraging real-time market analytics to make informed decisions that increase their visibility, strengthen their strategy and improve their position against the competition.

