Boost innovation with granular assortment analysis and real-time launches
Accelerate the development of new product lines, knowing in real time what is happening in the assortments of retailers and competitors anywhere in the world with all the details of each product and exactly in the format you need them.


Maximise your profits with detailed product insights from the market in any category
- Analyse the availability, prices and promotions of similar products in global markets.
Discover new opportunities to develop competitive products that maximise margin.
Reduce risks by optimising your decisions with up-to-date and relevant data.
Identify emerging trends in key categories before your competitors do.

Monitor innovations and trends and develop an appropriate assortment.
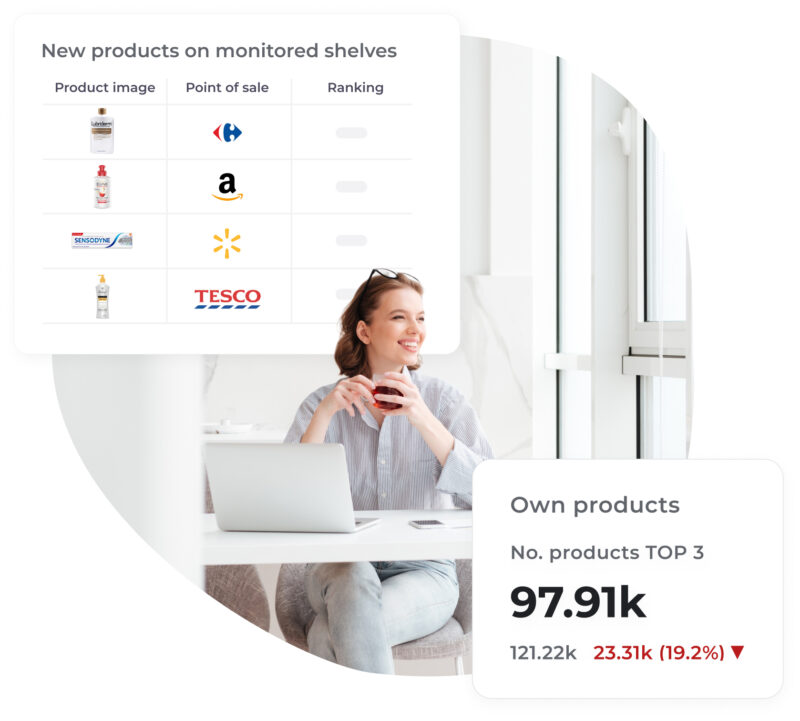
Track competitors’ new product launches immediately and adjust your assortment strategically.
Find out which products are most successful and which ones fail to stand out in the target markets.
Correlate feature data with prices, promotions, out of stocks or positions to detect relevant products.
Design assortments aligned with consumer expectations, based on accurate insights.


Save market research costs and analysis time and shorten your innovation cycles
Save up to 90% of the time spent on processing market report data by having exactly what you need at a click of a button.
Dramatically reduced investment in traditional market research.
Have the product information you need at maximum granularity, with your categories, and filtering out the data you don’t need.
Prioritise investments in innovation with information based on facts, not assumptions.

Use case: R&D/Market Research Department
Detect and analyse competitor innovations
Discover and analyse in real time the private label products launched in the Spanish market within your category, as a major personal care and hygiene manufacturer is already doing with flipflow.
Staying on top of competitive developments and identifying opportunities for innovation is key to maintaining a competitive advantage today.

