
Digital Shelf Intelligence
VISIBILITY IS NOT CONTROL.
GOVERNANCE IS.
Digital channels are not just a shop window. They are the primary platform for consumers to discover, compare and make decisions… both today and in the future. If you do not manage your digital presence (availability, content, visibility, competition and retail media) in a systematic way, you will not be able to control your growth.
Designed for:
Marketing
E-commerce
Retail Media

The illusion of digital control.
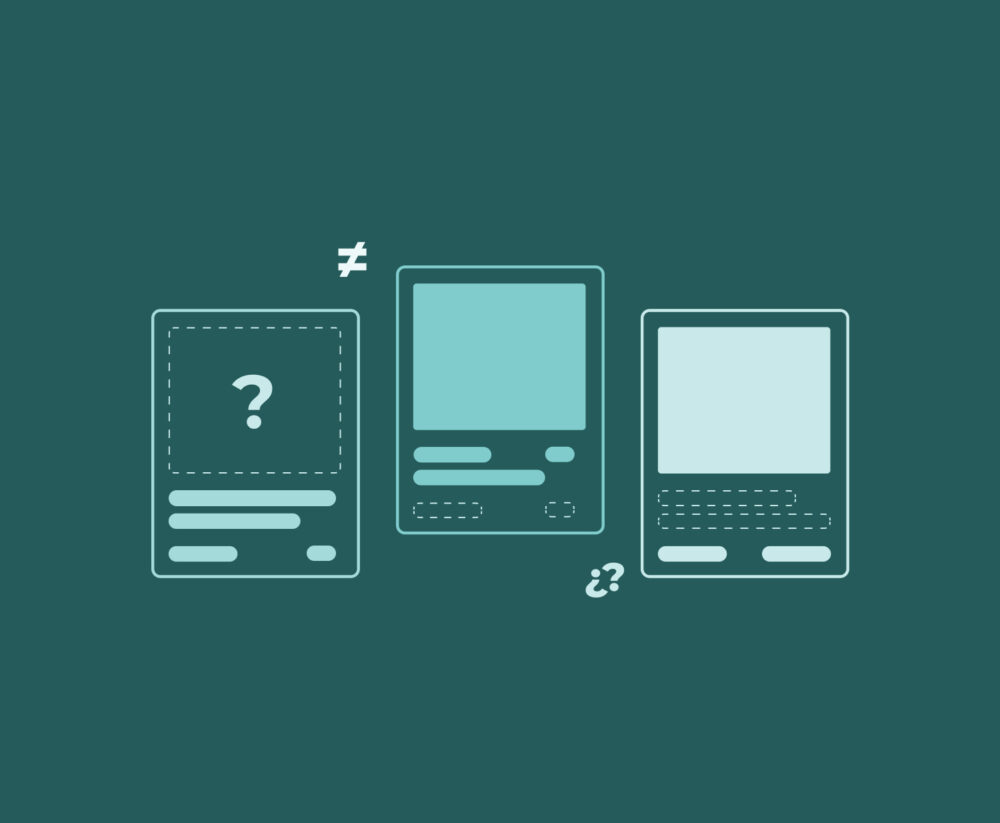
Most organisations believe they are in control by accumulating data: campaign reports, keyword dashboards, agency reports… But unstructured data obscures what is really happening in the market and what the priorities are:
You are not lacking information. You lack digital governance: a common framework for making the right decisions.
How we solve this at flipflow
Flipflow transforms the Digital Shelf into a digital governance system
We create a structural control layer that brings together what happens at each retailer and translates it into clear decisions to optimise shelf space.


Economic impact
Digital Shelf: more than just efficiency – revenue management
Managing the Digital Shelf goes beyond operational efficiency: it means turning visibility and content into actual revenue by identifying, at an early stage, opportunities that would otherwise be lost in terms of sales, market share or conversion.
| Traditional model | With flipflow |
|---|---|
| 1–3 staff members analysing dashboards | 50–80% reduction in reporting time |
| Manual reports by retailer | Unified cross-retailer model |
| One-off content review | Ongoing content and visibility audit |
| No link between visibility and pricing/availability | Link to Pricing & Assortment |
| Agencies operating without a structural audit | Structured and unified digital governance |
| Delayed reaction | Warnings before revenue is affected |
In high-turnover categories, even a small improvement in search ranking can, on its own, cover the annual cost of this module.

Case Study | Retail | Food & Beverages
Monitoring of distribution by store and brand image throughout Mexico
The Mexican group, a global leader in the dairy sector, optimises store checks, monitors prices and stock levels, and improves visibility, with its entire team aligned.
+26%
SHARE OF SHELF
+9%
INCREASE IN ON-OFF SELL-OUT
+35%
ROI OF RETAIL MEDIA CAMPAIGNS
Integration with the other modules
Digital governance is a key component of the system

Digital Shelf Intelligence integrates with:
Assortment & Territorial Intelligence
Territorial control of the product range and competitive gaps.
Designed for: trade marketing teams, category management teams and sales management.
Pricing & Seller Control
Alignment between regional product range and pricing strategy.
Designed for: revenue, trade marketing, marketplace, pricing and sales management teams.
Customer Sentiment Intelligence
Consumer perception linked to actual availability.
Designed for: consumer insights, marketing, e-commerce and product teams.

And above all, with…
Tyrell AI
Weekly executive summary
Flipflow is not a standalone module. It is part of a coordinated architecture.
Flipflow is not a standalone module. It is part of a coordinated architecture.

The Digital Shelf is commercial infrastructure.
Without any control, your revenue will be at the mercy of the algorithm.