Project Description

Detect and analyse competitor innovations

Discover and analyse in real time the private label products launched in the Spanish market within your category, as a major personal care and hygiene manufacturer is already doing with flipflow.
Staying on top of competitive developments and identifying opportunities for innovation is key to maintaining a competitive advantage today.

Identifying new developments in the market

This manufacturer can discover before anyone else the products that competitors (especially other private label manufacturers) are introducing in the Spanish market and take advantage of them.

For example, they have created a customised dashboard in which they analyse new launches in the market and give them a ‘newness’ percentage, which indicates the time elapsed since their introduction. This dashboard also includes information on the positioning and average price of each product.
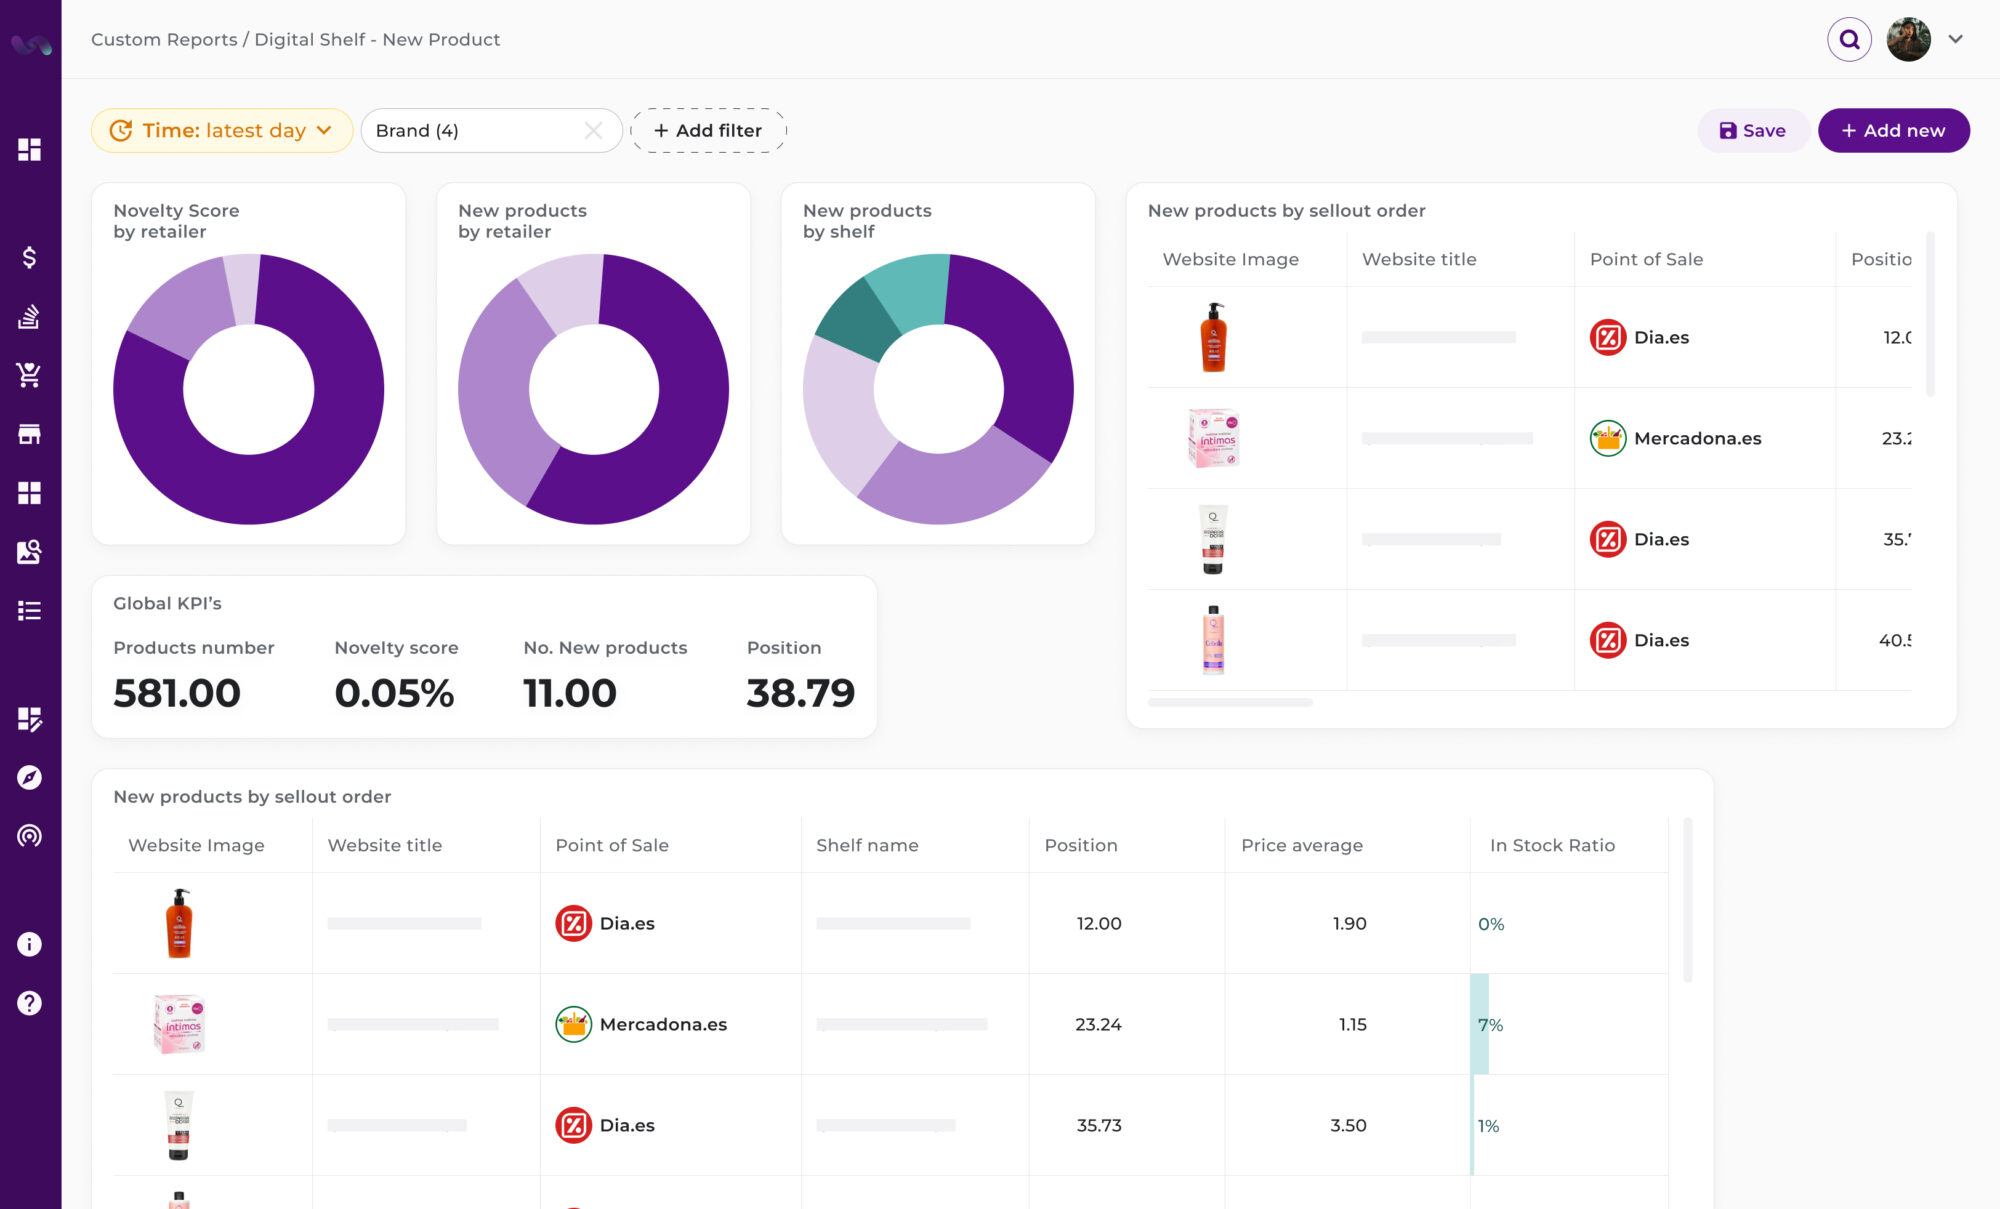
Custom digital shelf report dashboard with donut charts showing novelty scores, new products by retailer and shelf. It also includes global KPIs such as total products (581), novelty score (0.05%), and a table listing new products by sellout order, featuring retailers like Dia and Mercadona with metrics like position, price average, and in-stock ratio.
Number one

24/7 automated monitoring

Flipflow scans key marketplaces and retailers in real time, detecting new products in the category of interest to the manufacturer as they appear.

Number two

Detailed analysis of key attributes

They can find out details such as prices, formats, ingredients or characteristics of each new product in order to assess its impact on the market.

Number three

Intelligent and customisable alerts

Their product R&D teams receive automatic notifications configured according to their interests, whether by brand, product segment or specific retailer.

Analysis of outstanding proposals

With the analytics provided by our platform, they understand what their competitors’ strategies are and make decisions based on accurate data.
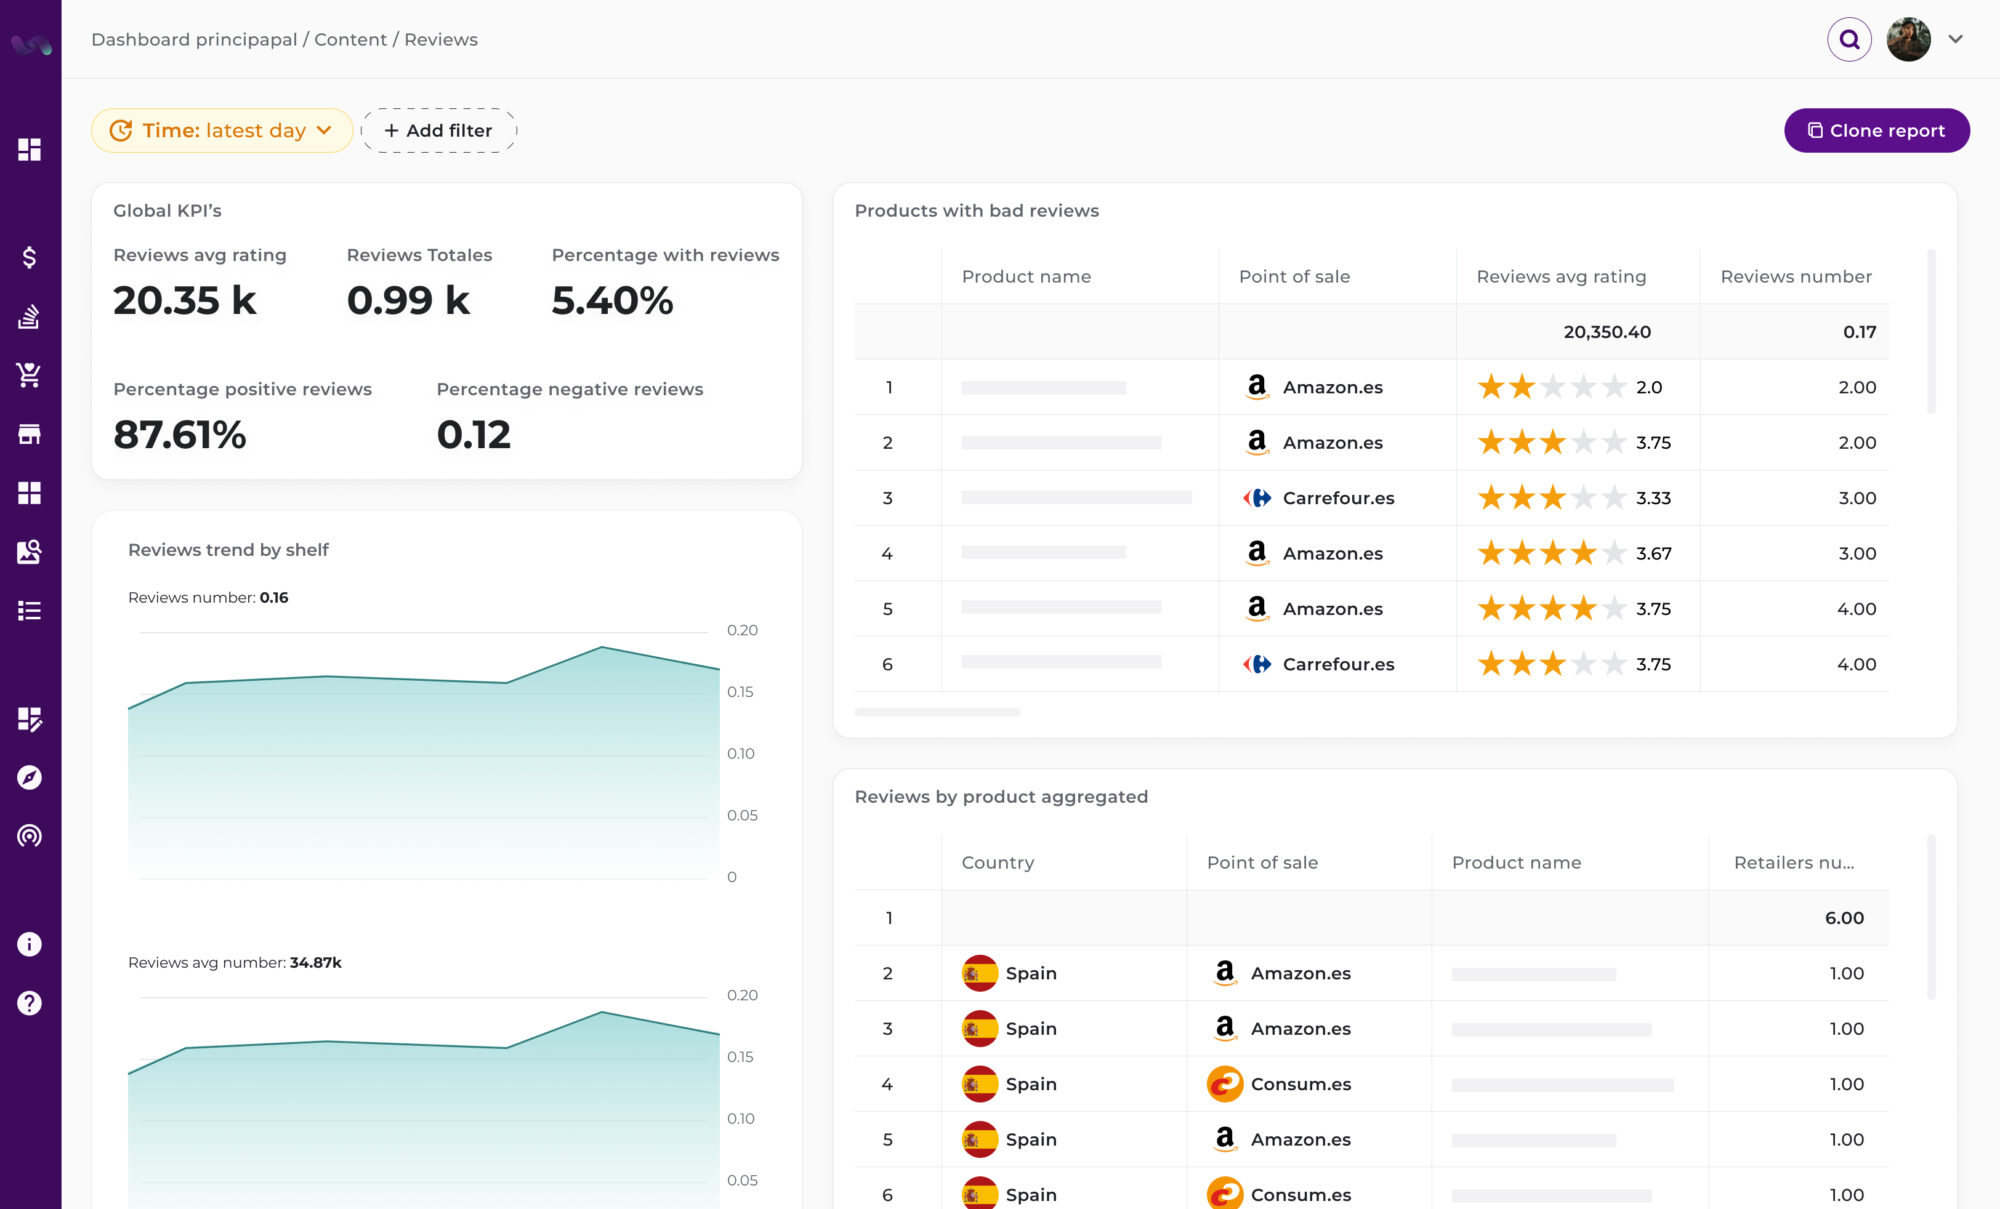
Content and review analytics dashboard displaying global KPIs such as review average rating (20.35k), review totals (0.99k), and percentage of positive reviews (87.61%). Includes a table of products with bad reviews, trend charts by shelf, and aggregated reviews by product and country for retailers like Amazon and Carrefour.
Number three

Market performance assessment

They analyse the acceptance of new products through indicators such as ratings, reviews and stock levels. In addition, they also review fluctuations in the position of products within categories and searches in the digital channel, which gives them insight into their relative sellout.

Number one

Comparison with its current offer

They visualise the differences and similarities between competitors’ products and their own, identifying opportunities for improvement.

Number two

Trends in consumption

They observe growth patterns in new categories or segments, to anticipate market needs, by doing assortment analysis based on standardised characteristics established through AI by flipflow.

Incorporating innovations into their strategy

The personal care and hygiene products manufacturer takes advantage of market developments to strengthen its offer and improve its competitiveness.

Database icon with a checkmark and multiple 'NEW' labels surrounding it, symbolizing the addition of new product data to a verified and centralized system in retail analytics.

Data-driven development of new references

Its innovation teams use the insights gained to inspire the creation of products that are more responsive to consumer demand.

Tiempo real

Time-to-market reduction and cost savings

They optimise their market strategy by significantly reducing time-to-market and minimising operational costs. They obtain efficient and accurate analysis on a daily basis, enabling them to implement changes quickly and effectively, ensuring that they maintain their competitive advantage. In addition, by replacing costly market research conducted in different countries with real-time reports, they have made considerable savings.

Centralized database icon with a checkmark, surrounded by icons representing quality assurance, product packaging, and data connectivity, symbolizing verified and interconnected retail analytics data.

Optimisation of existing supply

They adjust their portfolio according to the insights obtained, improving formulations, packaging design and value proposition.

Discover flipflow in action

Fill out the form and explore the intelligent platform that is transforming retail. We will contact you to analyze and understand how we can help you make the best decisions in real time:

  • Control your distribution network

  • Monitor your competitors

  • Secure your position in the Digital Shelf