Have the best real-time information. Don’t waste time and resources analyzing data from different sources with disparate formats.
Have all the daily, granular, quantitative market data according to your business logic. Base your decisions on accurate information and save time in cross-referencing and transforming data.


Have the information exactly as you need it with all daily product and assortment data in full detail
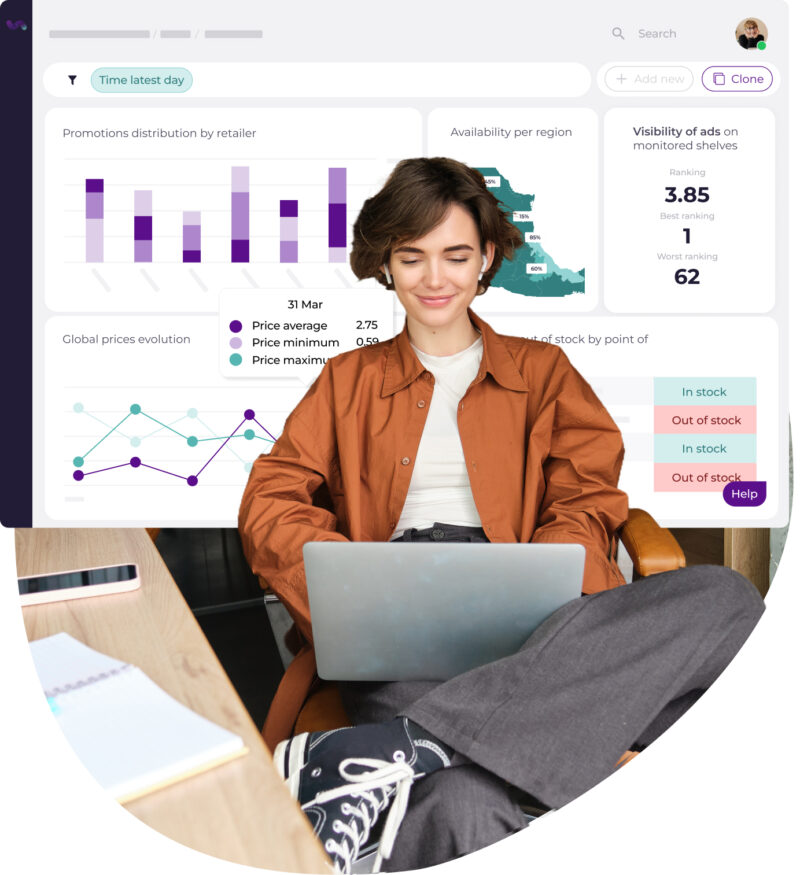
Simplify your analysis by consulting key metrics in real time and from a single place.
Save time and reduce errors by having the information according to your business logic, just a few clicks away and always up to date.
Have unlimited dashboards and customized reports for each key user in your company.
Configure with our team metrics, dimensions, dashboards and recurring usage reports that are always up to date.

Integrate your company’s proprietary information into our platform for a personalized view of the market
Get direct insights by visualizing market information with your taxonomies, categories and business logic.
Configure customized dashboards that reflect your business priorities, with analysis tailored to your business KPIs.
Leverage proprietary data integration to correlate in a single platform with market information.
Overcome the limitations of having dispersed market data by consolidating it into a single platform.


Use our API to get the data you want to integrate with your own tools
Ease the flow of information between platforms to optimise and streamline your processes.
Extract data from flipflow to visualisation applications like Power BI with just a few clicks. Even do it from Excel.
Select the key indicators you wish to consult from our API based on configurable reports.
Reduce time and errors by implementing automatic processes that update and synchronise your tools in real time.

Use case: R&D/Market Research Department
Detect and analyse competitor innovations
Discover and analyse in real time the private label products launched in the Spanish market within your category, as a major personal care and hygiene manufacturer is already doing with flipflow.
Staying on top of competitive developments and identifying opportunities for innovation is key to maintaining a competitive advantage today.

