A tailor-made solution to monitor your distributors and competitors
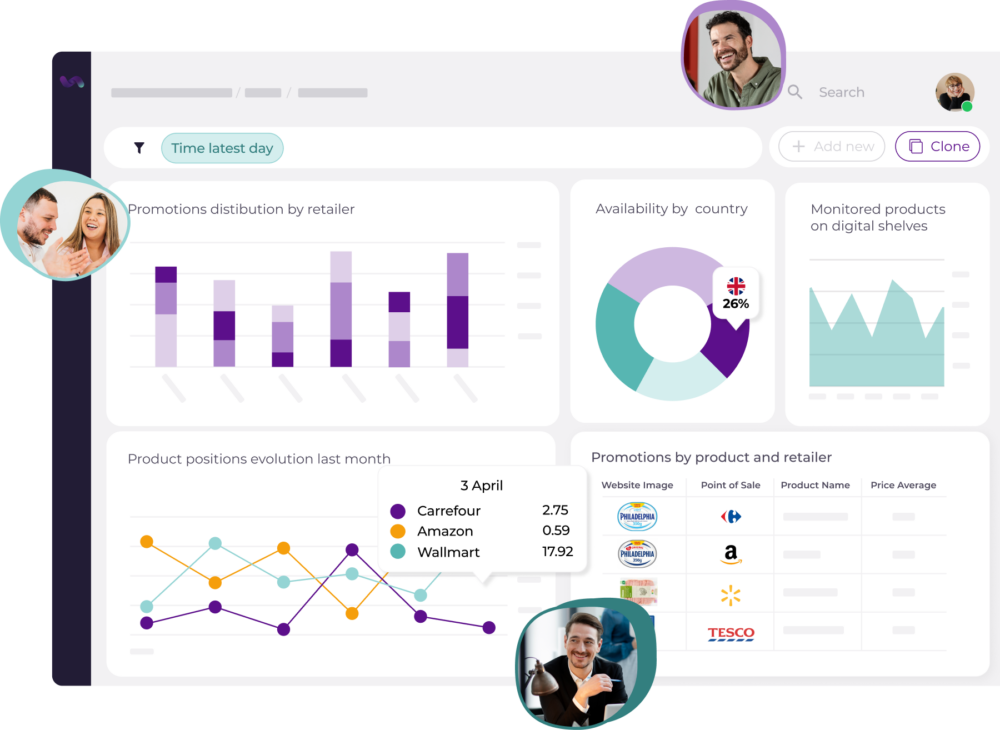
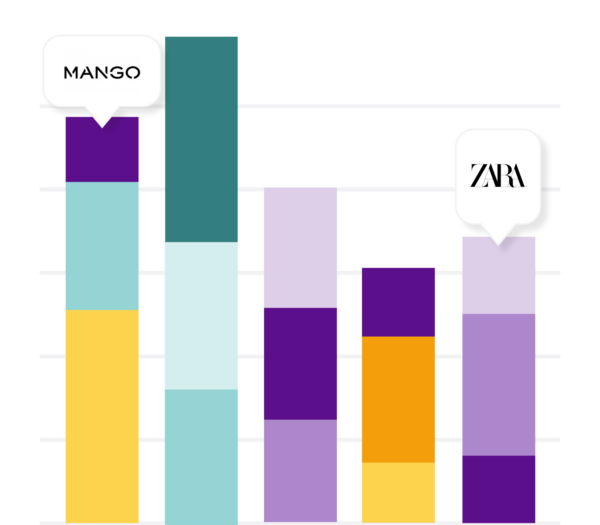
Monitor your prices and promotions on a daily basis. Keep an eye on your competitors’ prices as well
Setting the right pricing policy, based on intelligence and Big Data, can mean very significant variations in your revenue and sales.
Improve your revenue and margins with pricing policies based on real-time data.
Monitor pricing policy infractions or detect unauthorized sales.
Monitor your competitors’ prices, know how they fluctuate and also the promotions they apply.

Avoid lost sales with real-time stock information and alerts
Shortages and stock-outs at retail outlets can mean millions of sales not generated.
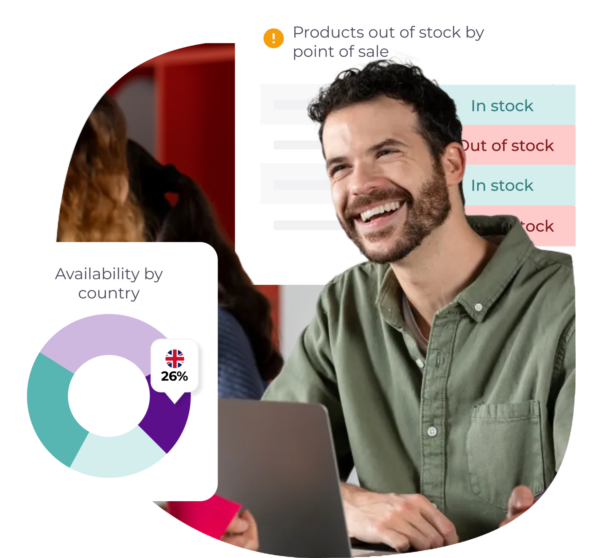
Visualize in real time the availability of each point of sale.
Receive out of stock alerts, also from your competitors’.
Automatically alert your sales network to take action.
Monitor the status of your stock in all retailers, marketplaces and sellers that you indicate, without limitations.
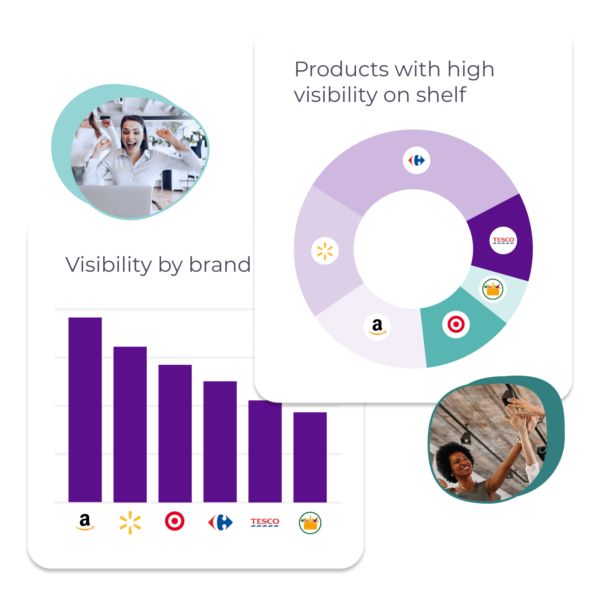
Monitor your visibility quota and check how your brand is being sold
Take a step beyond pricing and find out how your brand’s products are selling.
With our Digital Shelf Analytics tool, monitor your category positions, queries, and brand visibility.
Check product page by product page throughout the market every title, description, number of images, bullet points and A+ content.
- Have compliance and quality reports by channel, retailer, category or brand, and correct any faults or mistakes.
- Receive alerts for negative reviews, new reviews or when the average rating of a product changes.

Monitor retail media at each point of sale
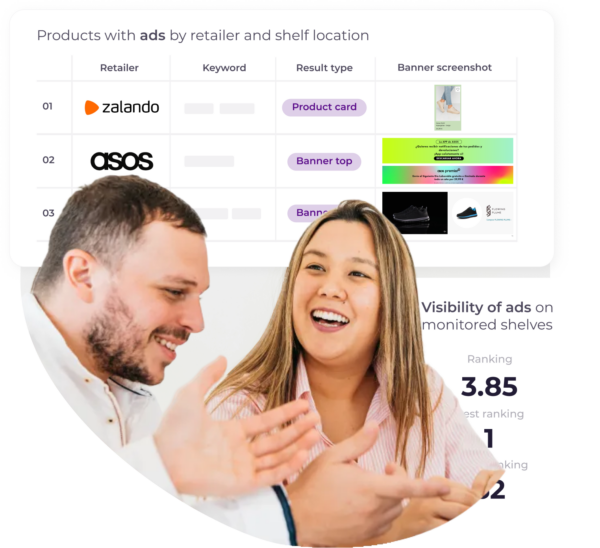
Promoted products on websites and marketplaces will be one of the main assets of paid marketing in the upcoming years.
Get information about paid ads within the monitored websites or marketplaces and their locations.
You will know what products your competitors are advertising every day or what products retailers are promoting.
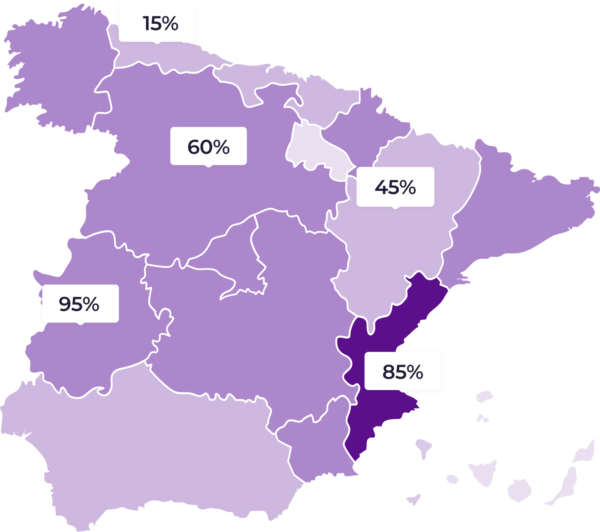
Monitor stocks and assortments by geographical area in sectors such as FMCG
The availability and price of food and consumer products depend on the area and postal code from which the consumer navigates and there are huge variations in prices and assortment in some retailers.
You can even generate automatic reports to alert your managers in each area of price changes or stock-outs.
Discover in this case study how a leading group in the manufacture and distribution of dairy and meat products with a presence in multiple retailers and stores spread over a large territory has achieved this.

RDP: Retail Data Platform
Total flexibility to provide useful information for your company
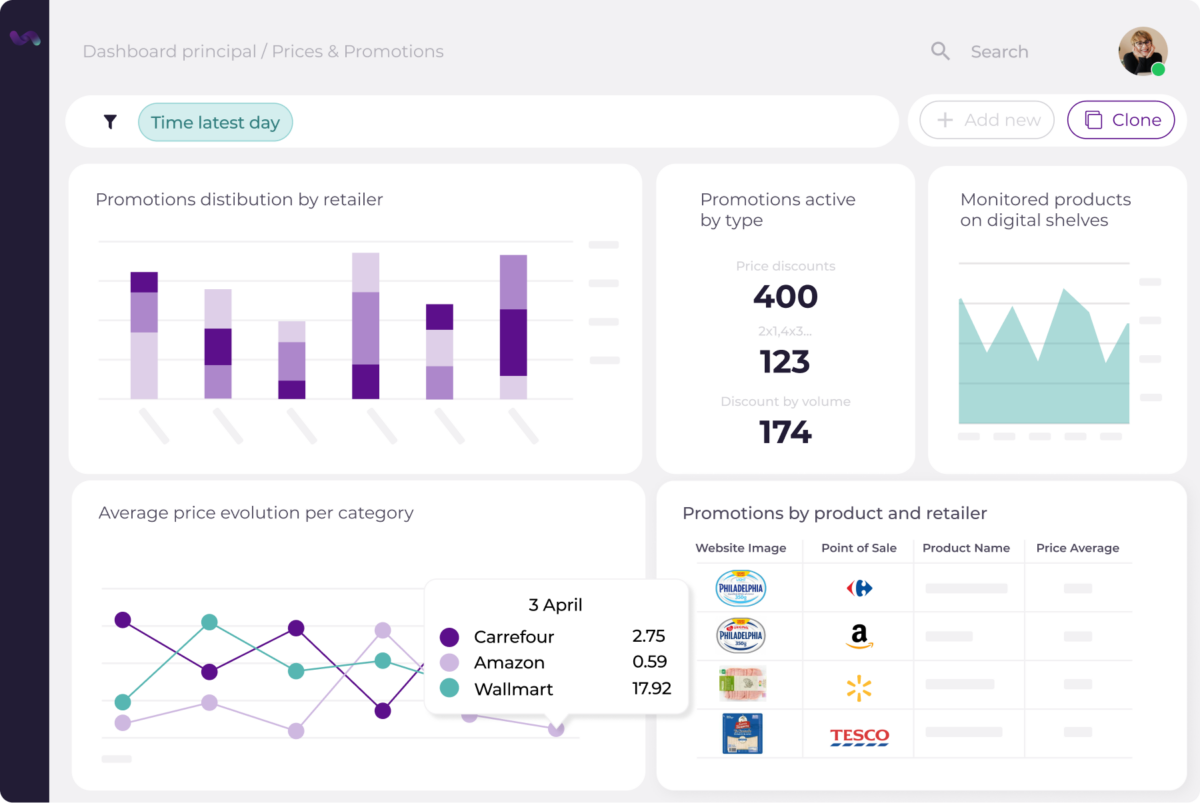
Our BI Data Explorer will allow you to:
- Cross-reference and analyse all available product and market information in a 100% flexible way.
- Create reports and charts for any team or profile in your company, so you have actionable insights for every part of your business.
Let’s speak in your language
Integrate all your company’s data into flipflow
Get 100% of your data available on a single platform.
Save time and make better decisions with all your context available.
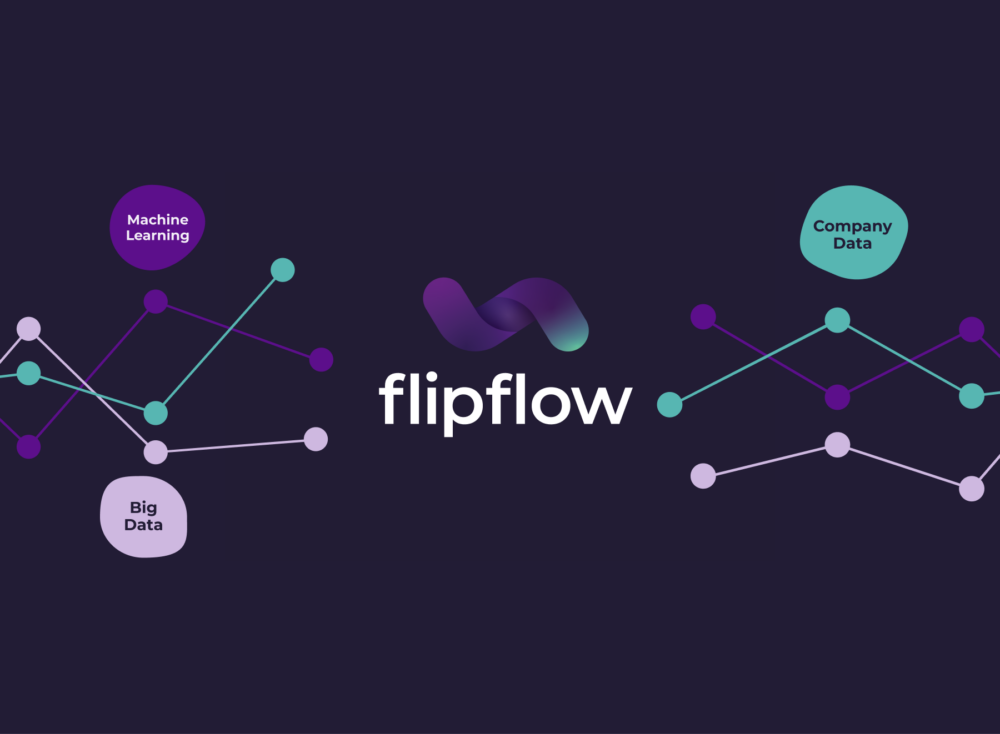
Una plataforma para unirlos a todos
Queremos que flipflow sea una herramienta estructural y el cerebro competitivo de tu compañía, increíblemente útil a lo largo y ancho de toda la empresa. Nos utilizan desde científicos de datos hasta responsables comerciales en su día a día, gracias a informes y alertas personalizadas.
Case study
With this platform, stepping forward
The iconic Brazilian flip-flop brand increases its DTC sales on European marketplaces by 31%, improves its control of resellers and compliance on pricing and manages to avoid 25% of channel conflicts.

Major brands and retailers around the world already trust flipflow.

