Monitor your position on the Digital Shelf and optimize your presence
You try to measure and improve your brand presence across multiple channels and countries. But there are too many digital shelves that make it impossible.
Our 360 Digital Shelf feature will help you monitor and optimize your brand position and image, impacting all sales channels.
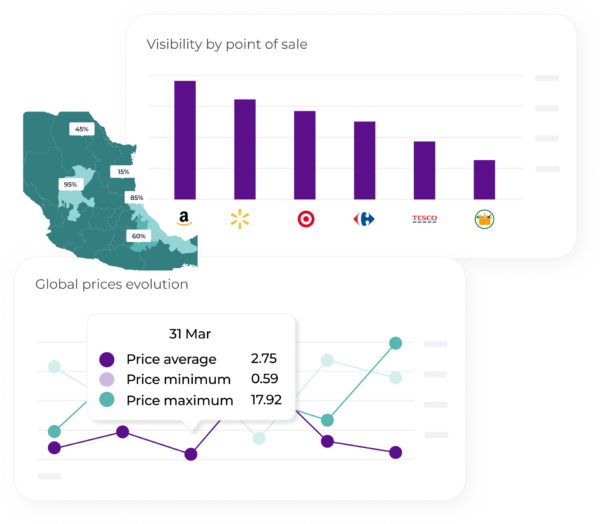
Improve the visibility of your products and boost your sell-out
Increase your revenue by positioning your products on digital shelves.
Have a clear idea of your share of visibility in the whole market vs. that of your competitors; or analyze the brands that are of interest to you.
Know your positions in categories and searches on a product-by-product basis to improve your performance.
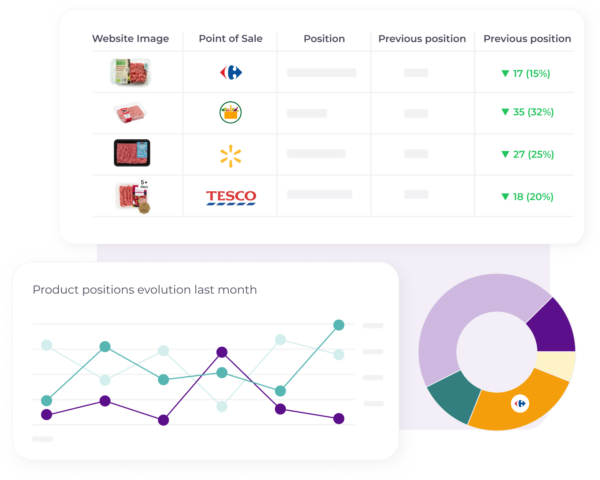
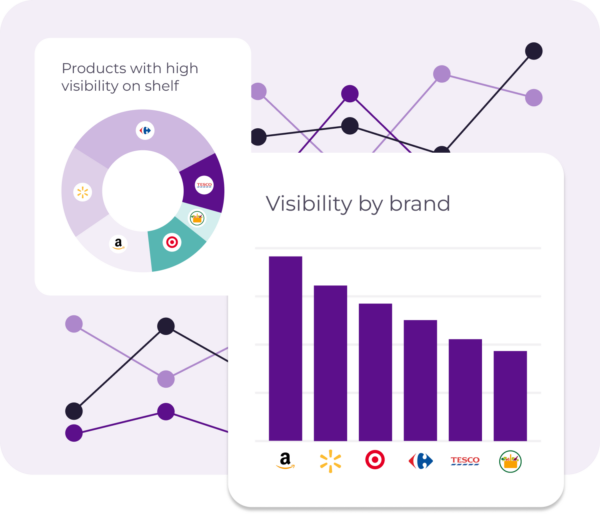
Digital shelves analysis is the new way to study markets
All your teams will be empowered with this tool and the insights needed to grow the business exponentially.
Know daily and in real time all the prices and promotions data of any retailer.
Be able to locate new products in any category and have information on each launch in real time.
Analyze products that are growing fast in sales and climbing positions to identify market trends in your categories.

Monitor Retail Media at every point of sale
Get information about paid ads within the monitored websites or marketplaces and their locations.
Discover what products your competitors are advertising every day or what products retailers are promoting.
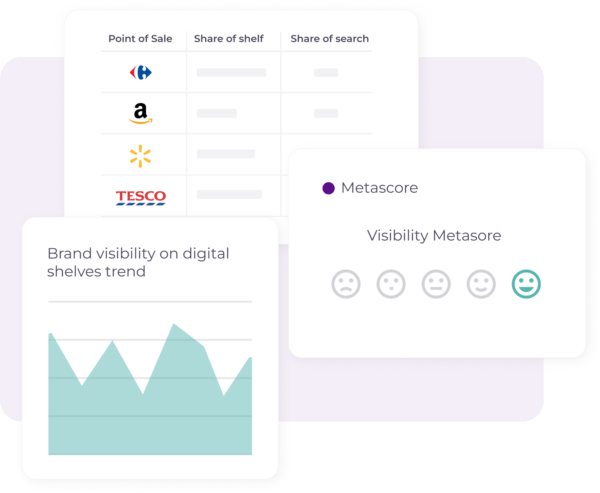

Use case: marketing department
Measure and improve brand Share of Shelf
Understanding and optimising your brand’s Share of Shelf is critical to strengthening your brand’s presence in category assortments and search, thereby boosting your competitiveness at the point of sale. With flipflow, brands such as a global leader in nutrition, health and wellness are leveraging real-time market analytics to make informed decisions that increase their visibility, strengthen their strategy and improve their position against the competition.

Major brands and retailers around the world already trust flipflow.

