Marketplaces and sellers control

Check daily changes in the Buy Box and all your sellers

Currently, a huge volume of sellers sell the same products every day on both 3P and 1P marketplaces and this causes chaos in distribution.

With our platform, you will be able to control sellers, Buy Box changes, prices and infringements. This way, you will maximize your Buy Box Share and your sales.

Request demo
A visual representation of Buybox share evolution over 30 days, including a line chart and a pie chart showing the distribution of 1P and 3P products. A table lists top sellers with more products under average price, including point of sale, seller name, and number of cheaper products.

Buy Box: Control who sells each product at any time and all its sellers

  • Know your Buy Box ownership percentages and maximize them to scale your sales.

  • Receive alerts of Buy Box losses or price changes in real time and react instantly.

  • Analyze in detail each seller that offers the products that are of interest to you in its assortment.
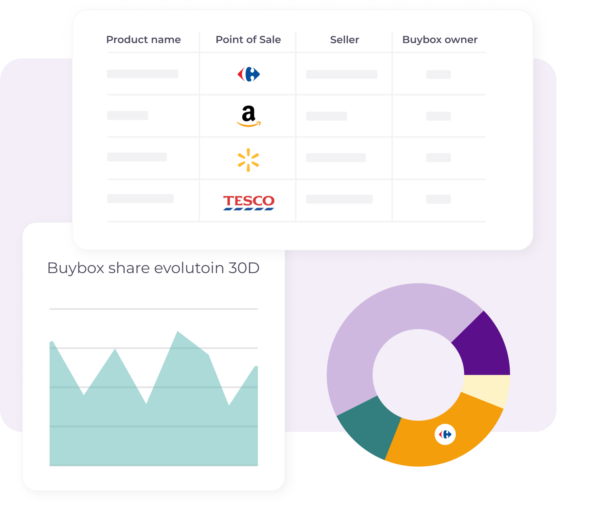
A visual representation of Buybox ownership and share evolution over 30 days. The image includes a table listing product names, points of sale, sellers, and Buybox owners, along with a line chart showing Buybox share changes over time and a pie chart likely representing the distribution of Buybox ownership among different retailers.
A visual representation of Buybox share evolution over 30 days, including a line chart and a pie chart showing the distribution of 1P and 3P products. A table lists top sellers with more products under average price, including point of sale, seller name, and number of cheaper products.

Boost your 1P/3P marketplaces strategy

  • Have sell-out, positioning and advertising information about your brand and your competitors for negotiations.

  • Analyze your positions in categories and queries to control and improve your brand positioning.

  • Control every detail about prices, availability, images or contents and get a global view to optimize each product listing.

A visual representation of Buybox share evolution over 30 days, including a line chart and a pie chart showing the distribution of 1P and 3P products. A table lists top sellers with more products under average price, including point of sale, seller name, and number of cheaper products.

Analyze in a single dashboard all product reviews from any channel

  • Monitor customer reviews in real time at product, brand, category or channel level.

  • Receive alerts for negative reviews, new reviews or when the average rating of a product changes.

  • Know first-hand what customers think of your brand and contrast it with your competitors.
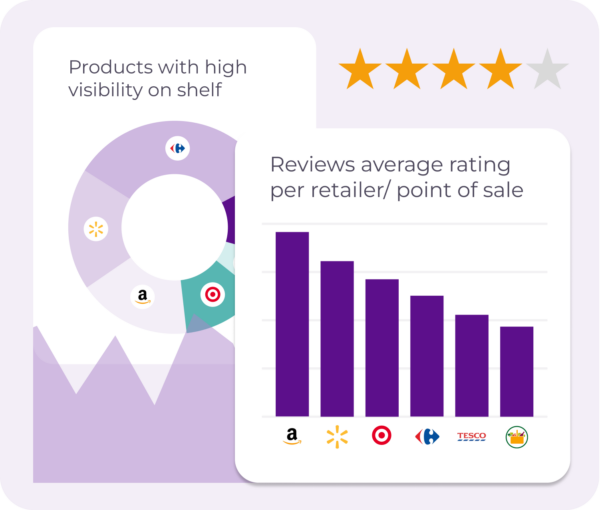
A visual representation of product visibility on shelves and average review ratings per retailer/point of sale. The image includes a pie chart showing the distribution of visibility across different retailers and a bar chart comparing the average review ratings for each retailer.

Case studies

Two people, a woman and a man, standing on rocky terrain by the ocean, each holding a surfboard above their heads. The woman is wearing a black one-piece swimsuit, and the man is in black swim shorts. The sky is overcast. Overlay text reads: 'Havaianas – Exponentially improving DTC sales thanks to daily distributor monitoring,' with 'Retail' and 'Fashion' tags beneath
Close-up of a woman's face as she applies a skincare serum using a dropper. The text on the image reads, 'Controlling compliance with pricing policies by distributors and 3P sellers,' with 'Retail' and 'Beauty' tags. The brand logo 'Natura Bissé Barcelona' is visible in the lower left corner.

Grandes marcas y retailers en el mundo ya confían en Flipflow

Logos
Logos
request demo