Project Description

Measure and improve brand Share of Shelf

Understanding and optimising your brand’s Share of Shelf is critical to strengthening your brand’s presence in category assortments and search, thereby boosting your competitiveness at the point of sale. With flipflow, brands such as a global leader in nutrition, health and wellness are leveraging real-time market analytics to make informed decisions that increase their visibility, strengthen their strategy and improve their position against the competition.

Real-time monitoring of overall brand visibility KPIs

The leading nutrition, health and wellness brand has access to key performance indicators through our platform, which allow them to continuously assess their brand’s visibility on digital shelves. These KPIs include metrics through which they can understand how their Digital Shelf presence is distributed, allowing them to quickly identify areas of opportunity:
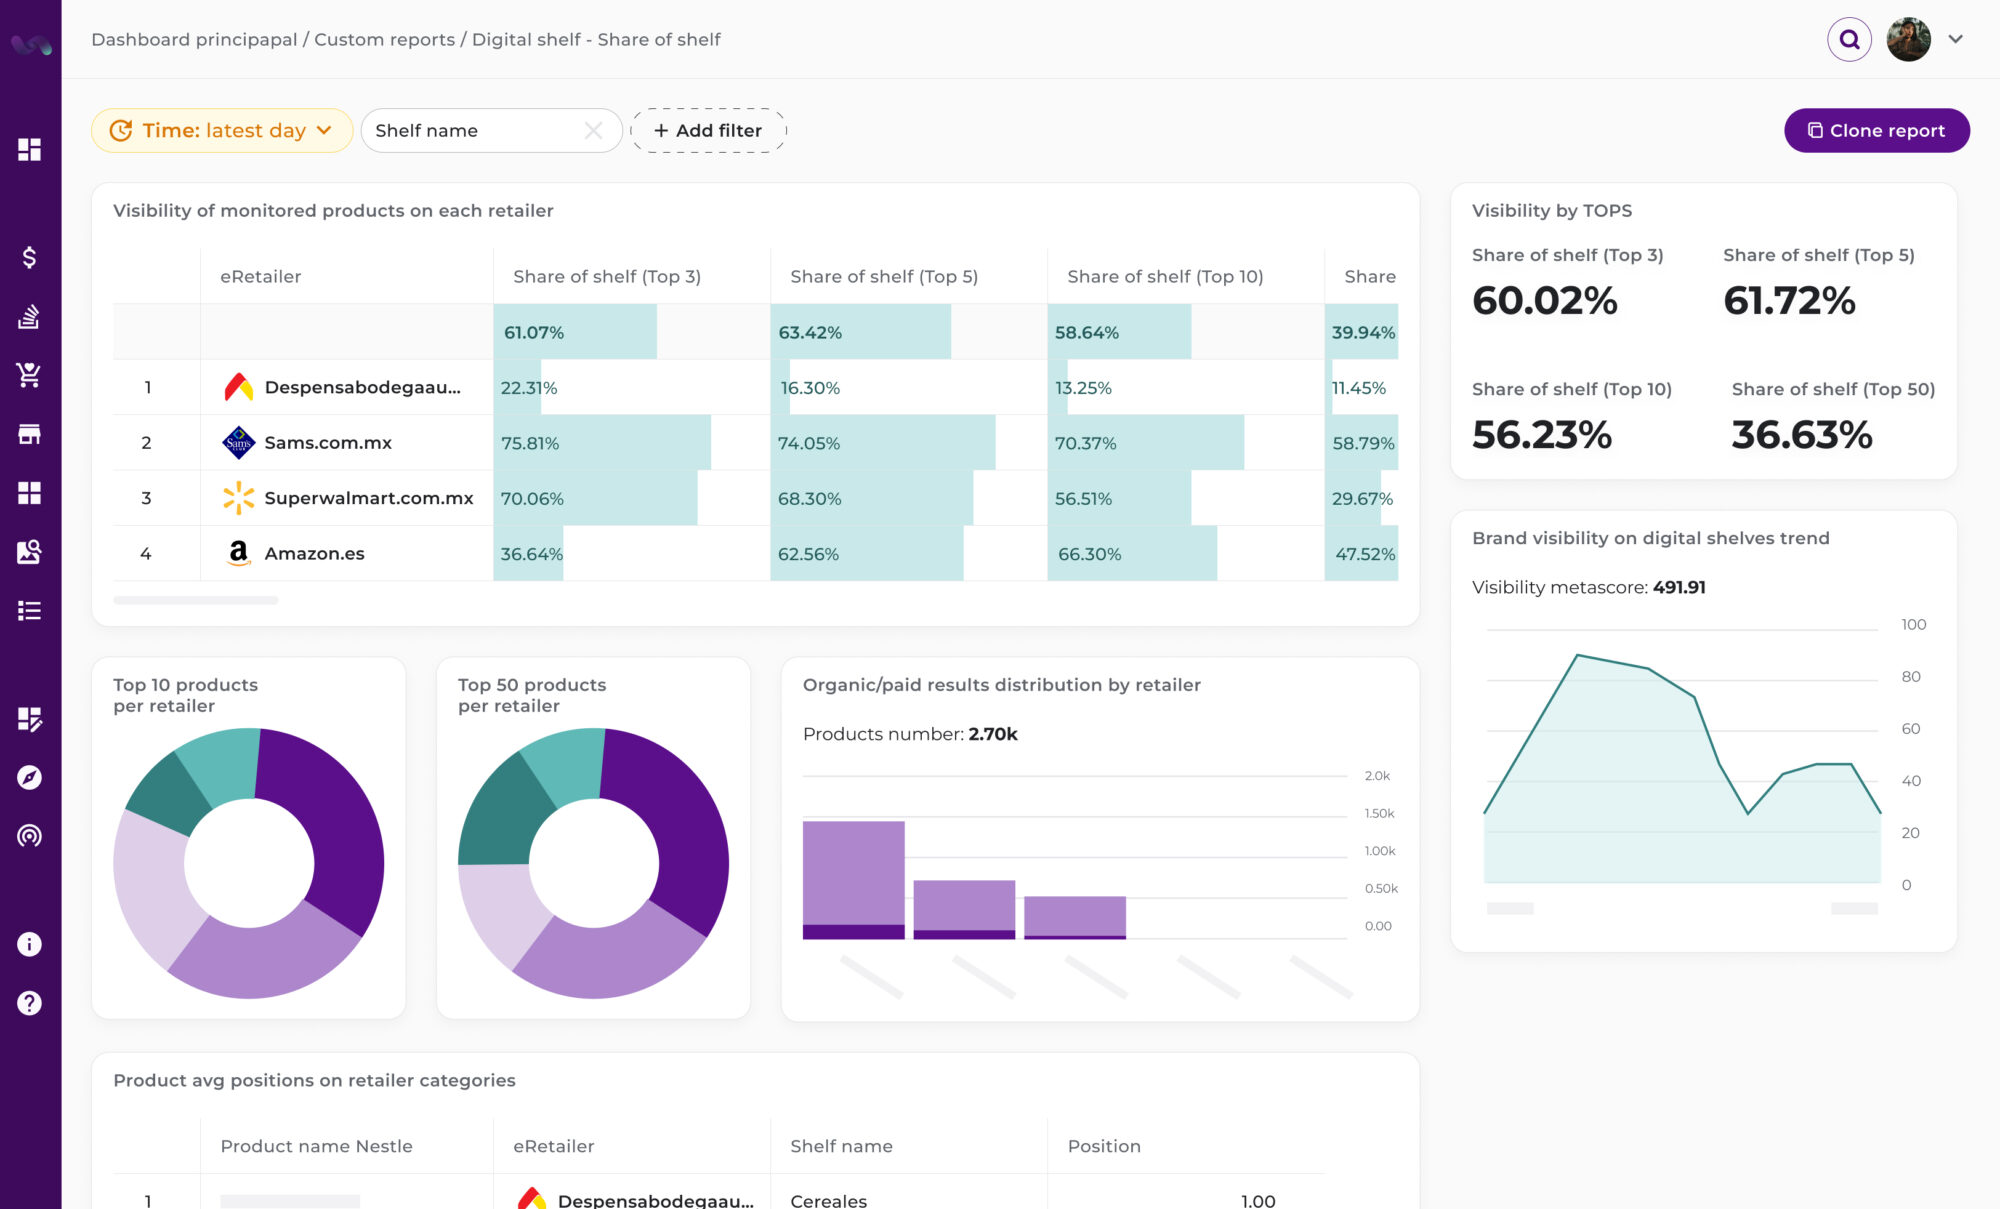
Dashboard for 'Digital Shelf - Share of Shelf' showing metrics for product visibility across eRetailers like Amazon and Walmart. Includes tables, donut charts for top 10 and top 50 product shares, and a line chart tracking brand visibility trends over time.
Number one

Shelf occupancy rate

The company can assess how much presence its brand has on the Digital Shelf compared to the competition.

Number two

Product distribution in different retail chains

They also have indicators to compare the performance of their brand in key retail chains in Mexico.

Number three

Product visibility by category

And they can measure how their products are positioned in the relevant categories at the point of sale.

Optimising keyword visibility and increasing digital presence

Brand visibility depends not only on what happens at the point of sale, but also on how it is searched and found on digital platforms. Flipflow enables this major global leader in nutrition and health to analyse and optimise its visibility based on specific keywords, especially on large platforms such as Walmart, for a comprehensive and effective Share of Shelf strategy:
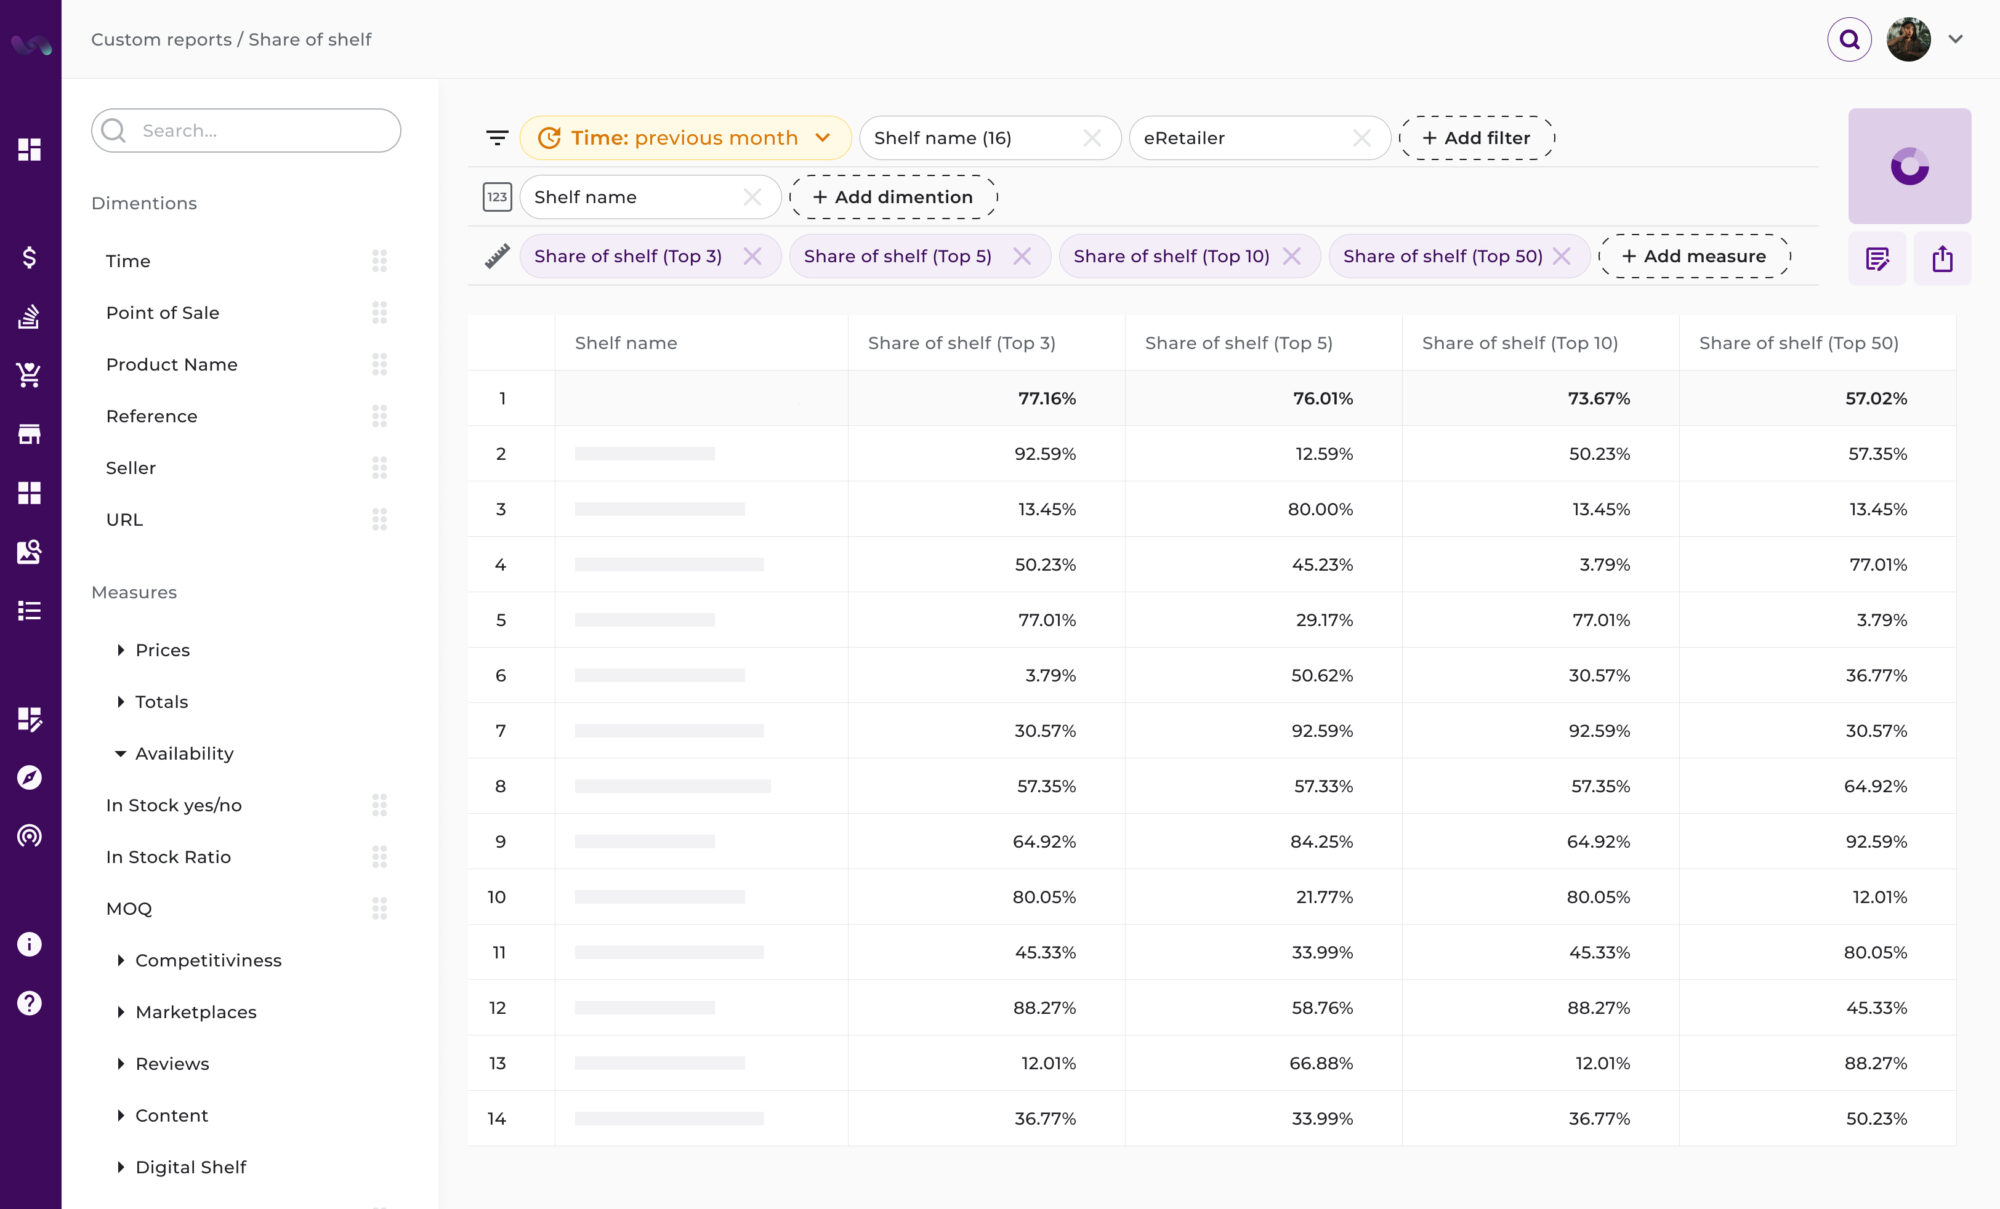
Custom report for 'Share of Shelf' displaying a table with metrics for shelf names and their shares in the top 3, 5, 10, and 50 positions across various eRetailers. Filters and dimensions are available on the sidebar for customization.
Number one

Keyword and search results monitoring and optimisation

They can see how their brand ranks by keyword on sites like Walmart, which helps them understand search trends and demand. Using our data, they implement actions to ensure their products rank high in search results, maximising their visibility.

Number two

Identification of flagship products

They analyse the ranking of best-selling products on digital shelves to identify their flagship products. By linking this information with Sellout data, they get a clear view of their actual performance, allowing them to optimise their commercial strategy.

Number three

Actions to improve Share of Shelf ranking

They identify and apply tactics to strengthen their brand presence in the Top 3, Top 5, Top 10 and Top 50 positions on the digital shelf, ensuring that their products are visible to the widest possible audience by priority and impact.

Daily analysis of actions to improve the Share of Shelf

The ability to make actionable, fast and effective decisions is key to maintaining a competitive advantage on the Digital Shelf. With Flipflow, this leading global brand implements targeted actions to improve its Share of Shelf through:

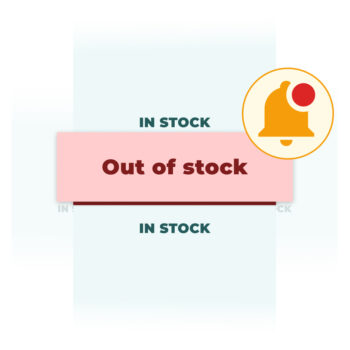
Illustration showing 'Out of stock' highlighted in red with 'In stock' above and below, alongside a notification bell with a red alert dot. Represents alerts for stock availability issues.

Automatic alerts and notifications

Receive instant notifications when their products decrease their presence on digital shelves or in promotions, allowing them to act immediately.

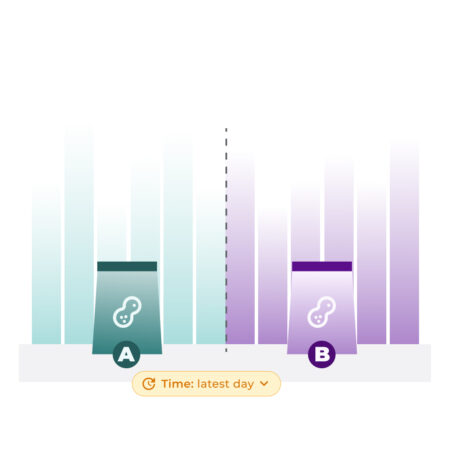
Illustration comparing two product categories represented by cat food bags (A and B) with bar graphs in the background, symbolizing performance comparison or sales trends over the latest time period.

Competition analysis

Through our tool, they get detailed information on how competing brands are positioned and adjust their promotional and content strategies accordingly.

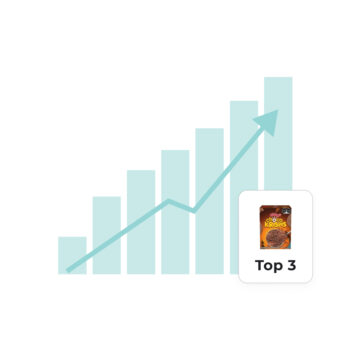
Illustration of a bar chart with an upward arrow indicating growth, featuring a product image (Choco Krispis) labeled 'Top 3.' Represents top-performing products within digital shelves.

Replenishment and redistribution recommendations

They also have reports with customised suggestions to maximise the exposure of their products on the Digital Shelf and improve their negotiations with the distributor to get more exposure for their products.

Discover flipflow in action

Fill out the form and explore the intelligent platform that is transforming retail. We will contact you to analyze and understand how we can help you make the best decisions in real time:

  • Control your distribution network

  • Monitor your competitors

  • Secure your position in the Digital Shelf