Analyse product assortments and trends to an unprecedented level, and real-time
Understand the entire market. Detect patterns, trends and characteristics at the highest granularity of any brand or retailer’s assortment, with real-time information.
Analyse all this information in the context of brands, prices, promotions, novelties and much more.

Monitor innovations and trends and develop an appropriate assortment.
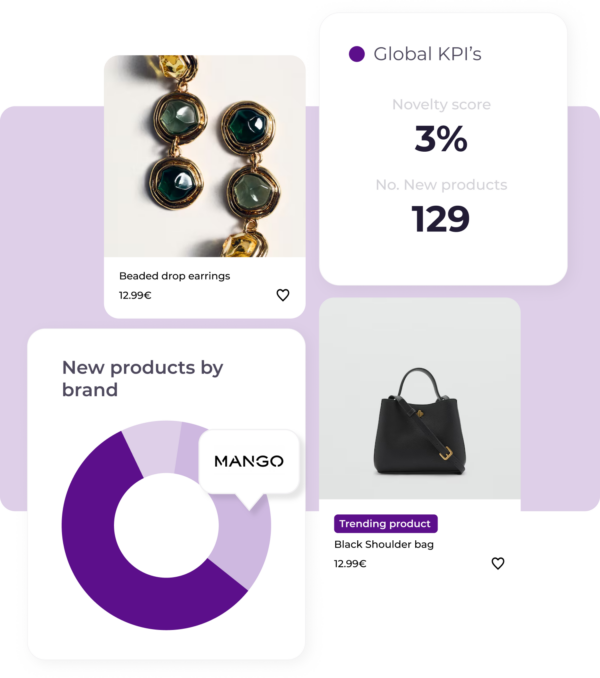
Detect in real time new products launched by any brand or retailer along with their features.
Correlate feature data with prices, promotions, out of stocks or positions to detect relevant products.
- Understand the trends and composition of complete, real-time assortments to maximise your catalogue and competitiveness.
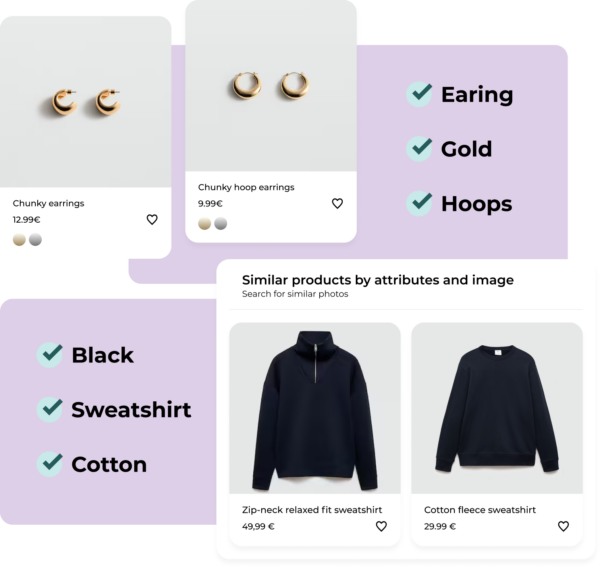
Analyse the market by characteristics and attributes, at the highest granularity
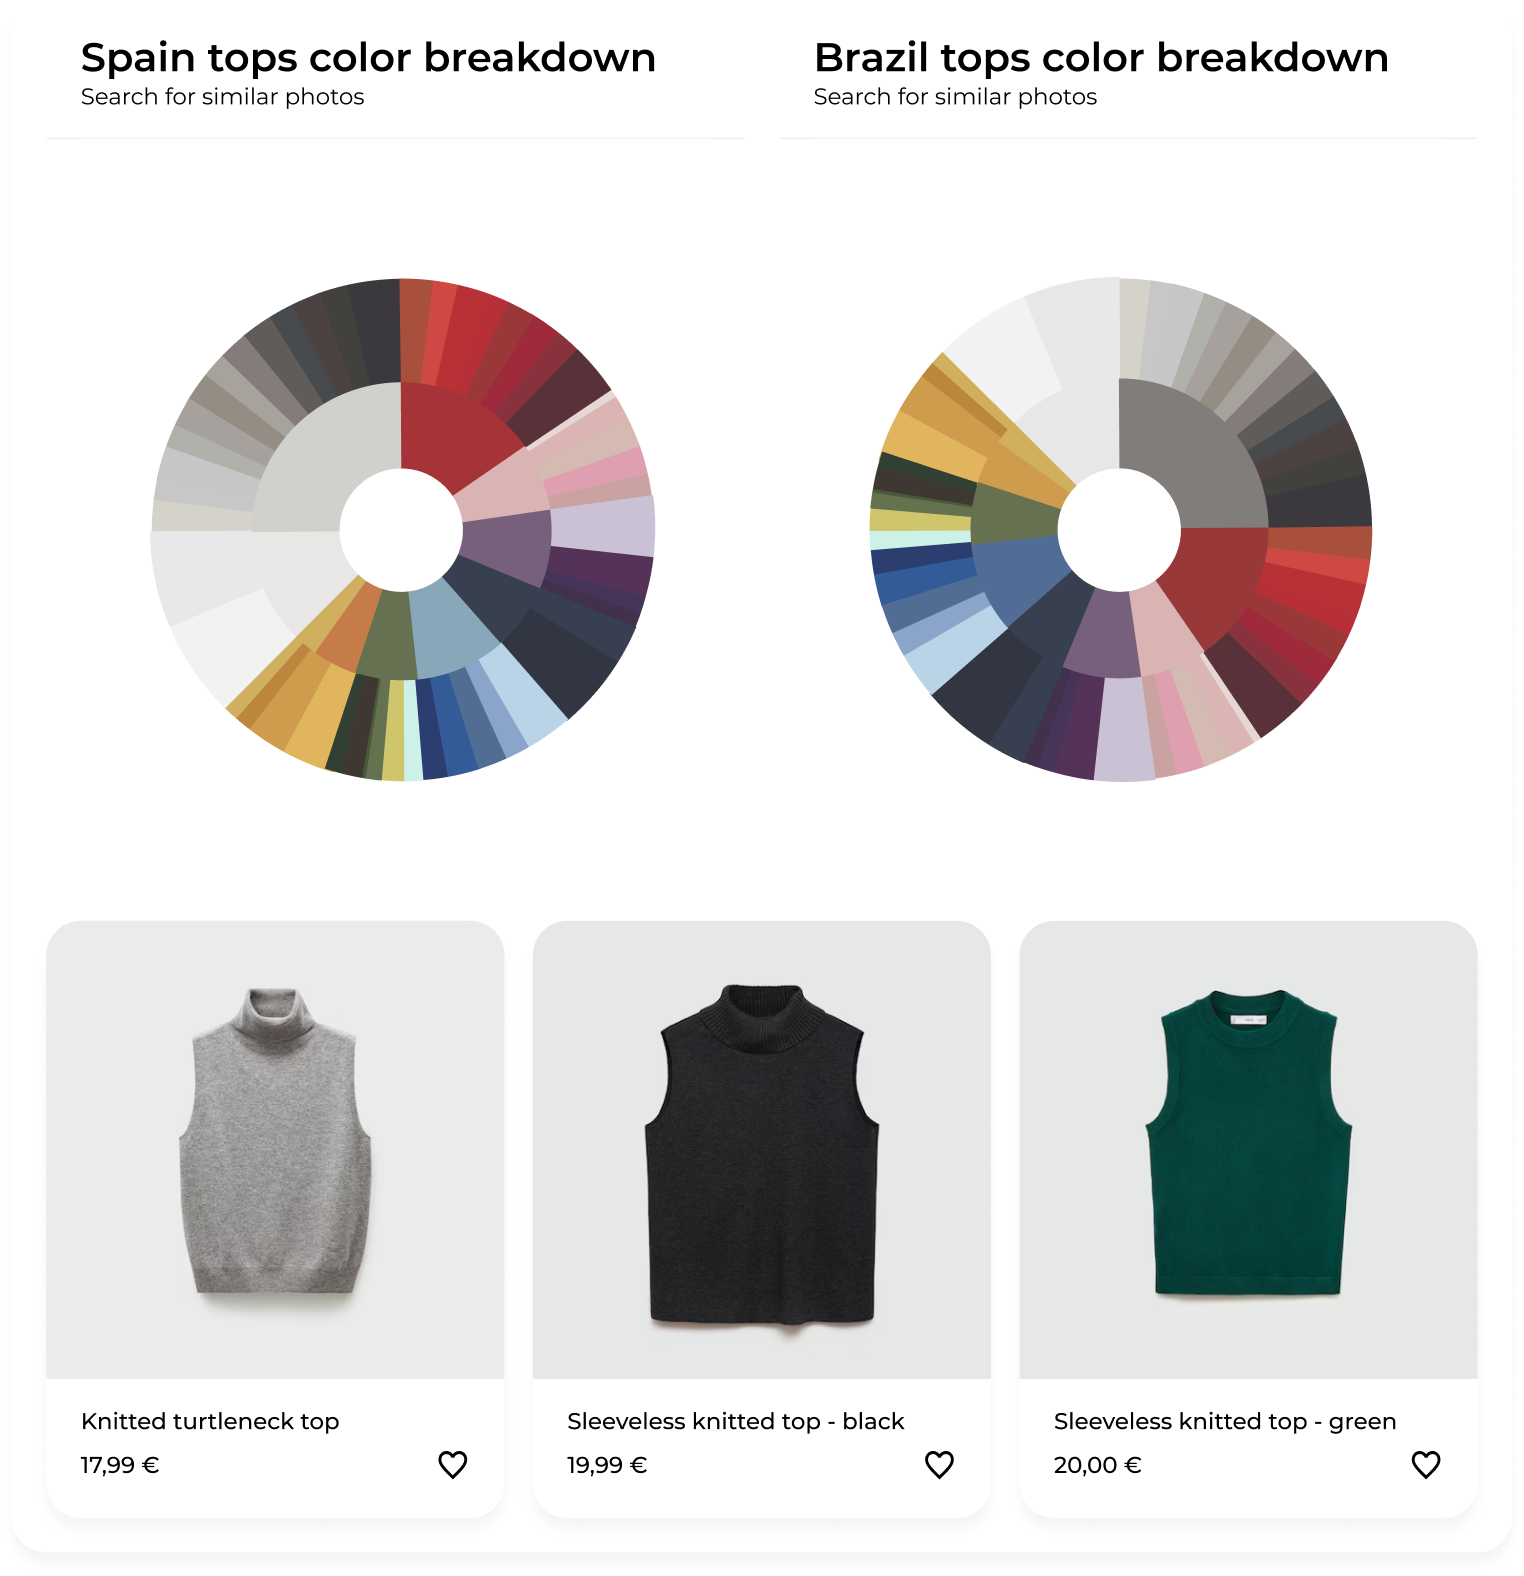
Analyse product by product or dig into assortments to understand what is working or what types of products are having the highest sellout.
- Our technology extracts any product’s categories and attributes from images and text with precision.
- You will have from colours, patterns or composition in fashion to formats, units or ingredients in food.

Save on market research costs and shorten your innovation cycles
- Own the market data and avoid cost overruns in costly and inefficient outsourced reporting.
- Set up alerts and automations to keep an eye on the market, from news to emerging trends.
In sectors such as FCMG, reduce investment in price and store checks and data purchases that do not follow your business logic.
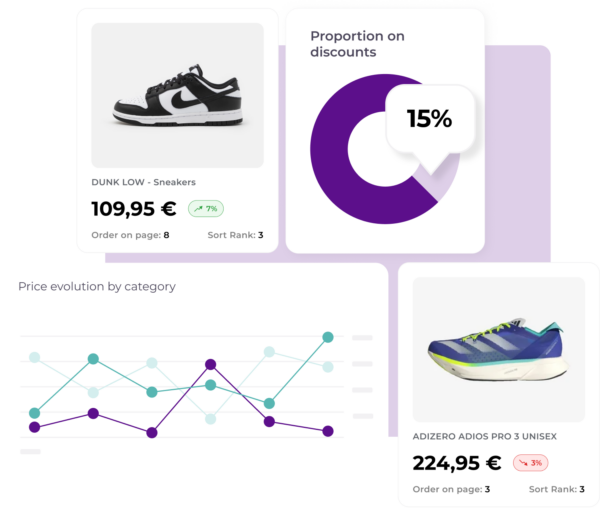
View historical brand and retailer assortment catalogues on a single platform to reduce time to market
- Analyse by periods all the information in each category.
- Introduce your own categories and logic so that you don’t have to invest resources in understanding the information.
- Monitor exactly the assortments and categories that are relevant to you.

Major brands and retailers around the world already trust flipflow.

