
Project Description
To have control over the data, that’s amazing
Case Study | Retail | Food & Beverages
Leading global group in the dairy industry reduces by 65% the costs of performing Store Checks thanks to having achieved 98% in daily data assertiveness at shop level. It also achieves daily and exhaustive control of prices, promotions, availability and brand visibility, increasing its Share of Voice and market share versus both proprietary and private label brands; and involves all its teams along the way.

1. Challenge
To achieve direct visibility over the whole Mexican territory
Grupo Lala faced the challenge of controlling the vast territory of a country like Mexico, with supermarkets from many different retailers in all regions of the country. Without direct visibility of all the distributors, it was simply an impossible task, which meant hours of manual work, loss of focus for the sales team and excessive investment in Store Checks and market reports from large consultancy firms.


Optimise their analysis to monitor the actions of retailers on a daily basis
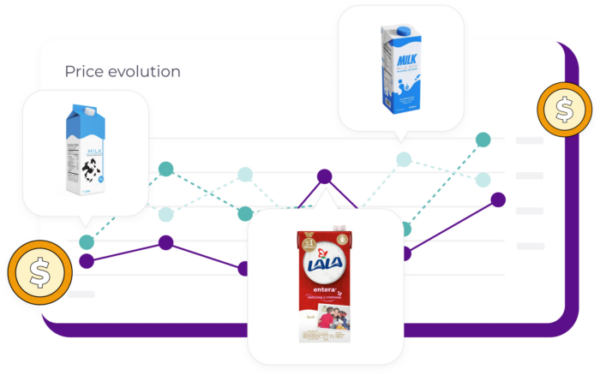
In addition, it also sought to optimise the dynamism of price analysis, promotions and assortments, allowing its Category Managers and Sales Department to have better control of retailer actions in real time. These departments relied on Nielsen’s Pricetrack tool, which gave them a 15-day delayed view of shops and limited coverage to certain supermarket chains.
Having real-time information on their brand position and competitiveness
The Marketing and E-commerce Department had another big challenge: to have real-time information on its brand positioning, to be able to analyse the brand share on different shelves/categories and with the data obtained to build comparative analyses between its products and those of its competitors. If they could achieve this, they would be able to infer the investments and strategies of their direct competitors in real time, and act accordingly.
Seeing this situation and being aware of the possibility of improving it thanks to current technological developments, Grupo Lala sought the help of a partner specialised in offering market monitoring and analysis in real time and at maximum granularity.
2. Solution
Data assertiveness and accuracy vs. Nielsen Pricetrack and in-store prices
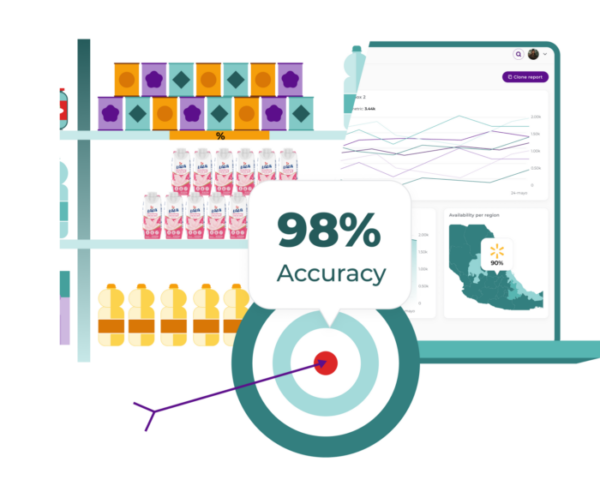
One of the main objectives for implementing daily market analysis and its use in the Sales Department was to be able to estimate the accuracy of the data collected online at shop level and the limitations that this could entail. Together with flipflow, Grupo Lala conducted an analysis that collected data on 10 products in different shops in Mexico, both historically and in real time through the Point of Sale Managers, and compared it with flipflow data.
The conclusions of the data provided by flipflow on its platform were as follows:
- Data assertiveness vs. Pricetrack Nielsen: 98%
- Assertiveness of availability data: 95%.
Impacted teams:
Direct visibility in a single dashboard that cross-references proprietary data in real time with data collected by flipflow
The group’s sales department, with Sellin and Sellout information, relied on multiple data cross-referencing to generate a monthly report comparing sales, prices, availability and promotional investments.
In addition, the company analyses data geographically in Nielsen Areas and also in its own internal areas, which consumed many hours of work having to adapt and filter reports.
Working with flipflow, they introduced the following improvements:
- Sellin and Sellout proprietary data uploaded into the flipflow platform for one-click cross-referencing.
- Instant visibility of data in a single dashboard and in their language.
- Inclusion of promotions and offers data by chain and shop for real-time variance monitoring.
- Structuring of all market information by their areas, which is automatically kept up to date.
Impacted teams:
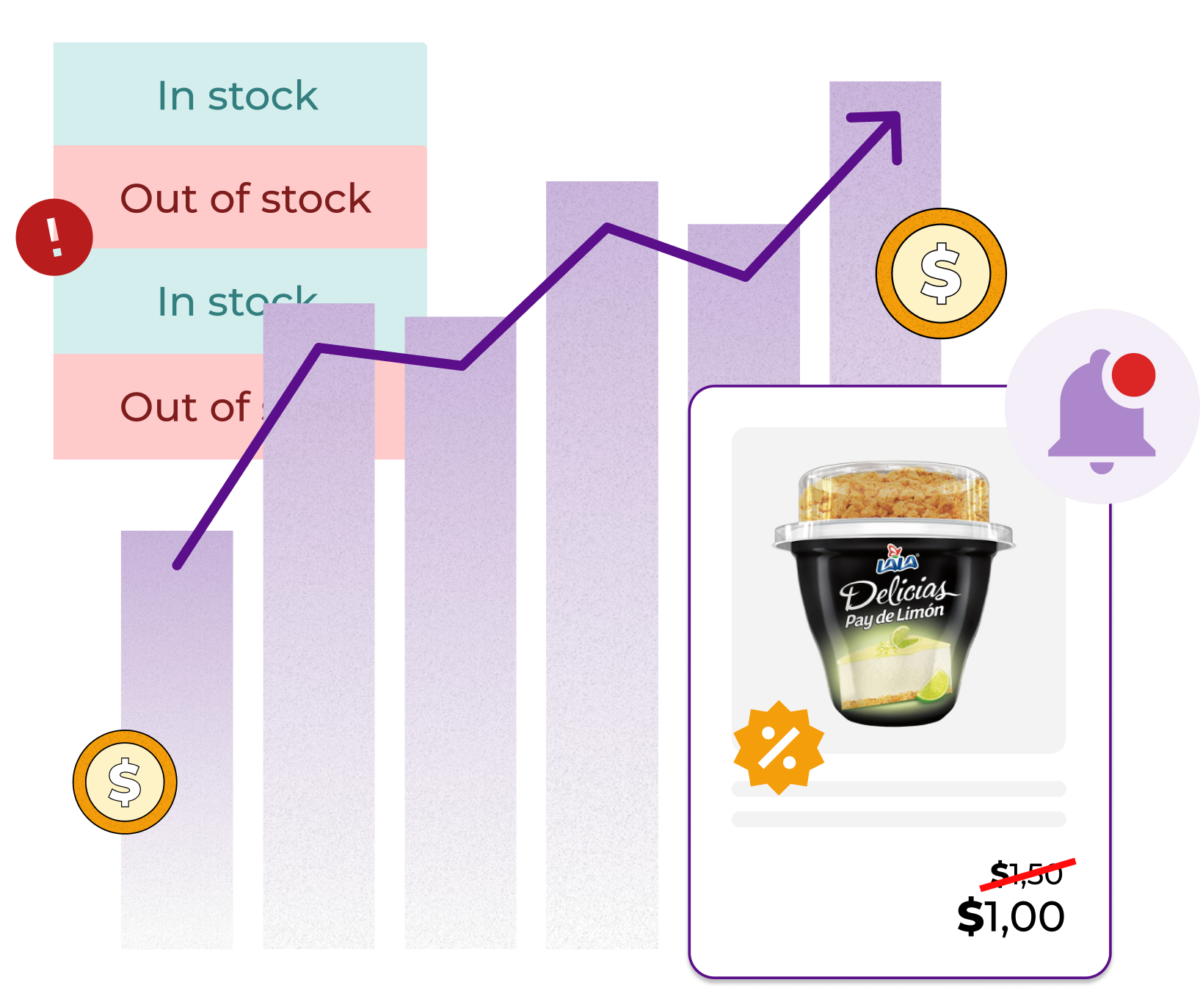
With these improvements, the leading global group in the dairy industry was able to have daily information at retailer and shop level on what is happening with its products and brands. With this information they control:
- Prices and promotions channel by channel and shop by shop validating that their policies are being complied with in real time
- Availability of each product per store to avoid losing sales due to stock-outs.
- Lack of assortment in order for their sales teams to act and maximise sales/sellin.
- Competitiveness in their categories by region versus their main competitors in each shop.
Impacted teams:

Market share monitoring with Share of Shelf and auditing of Retail Media deals
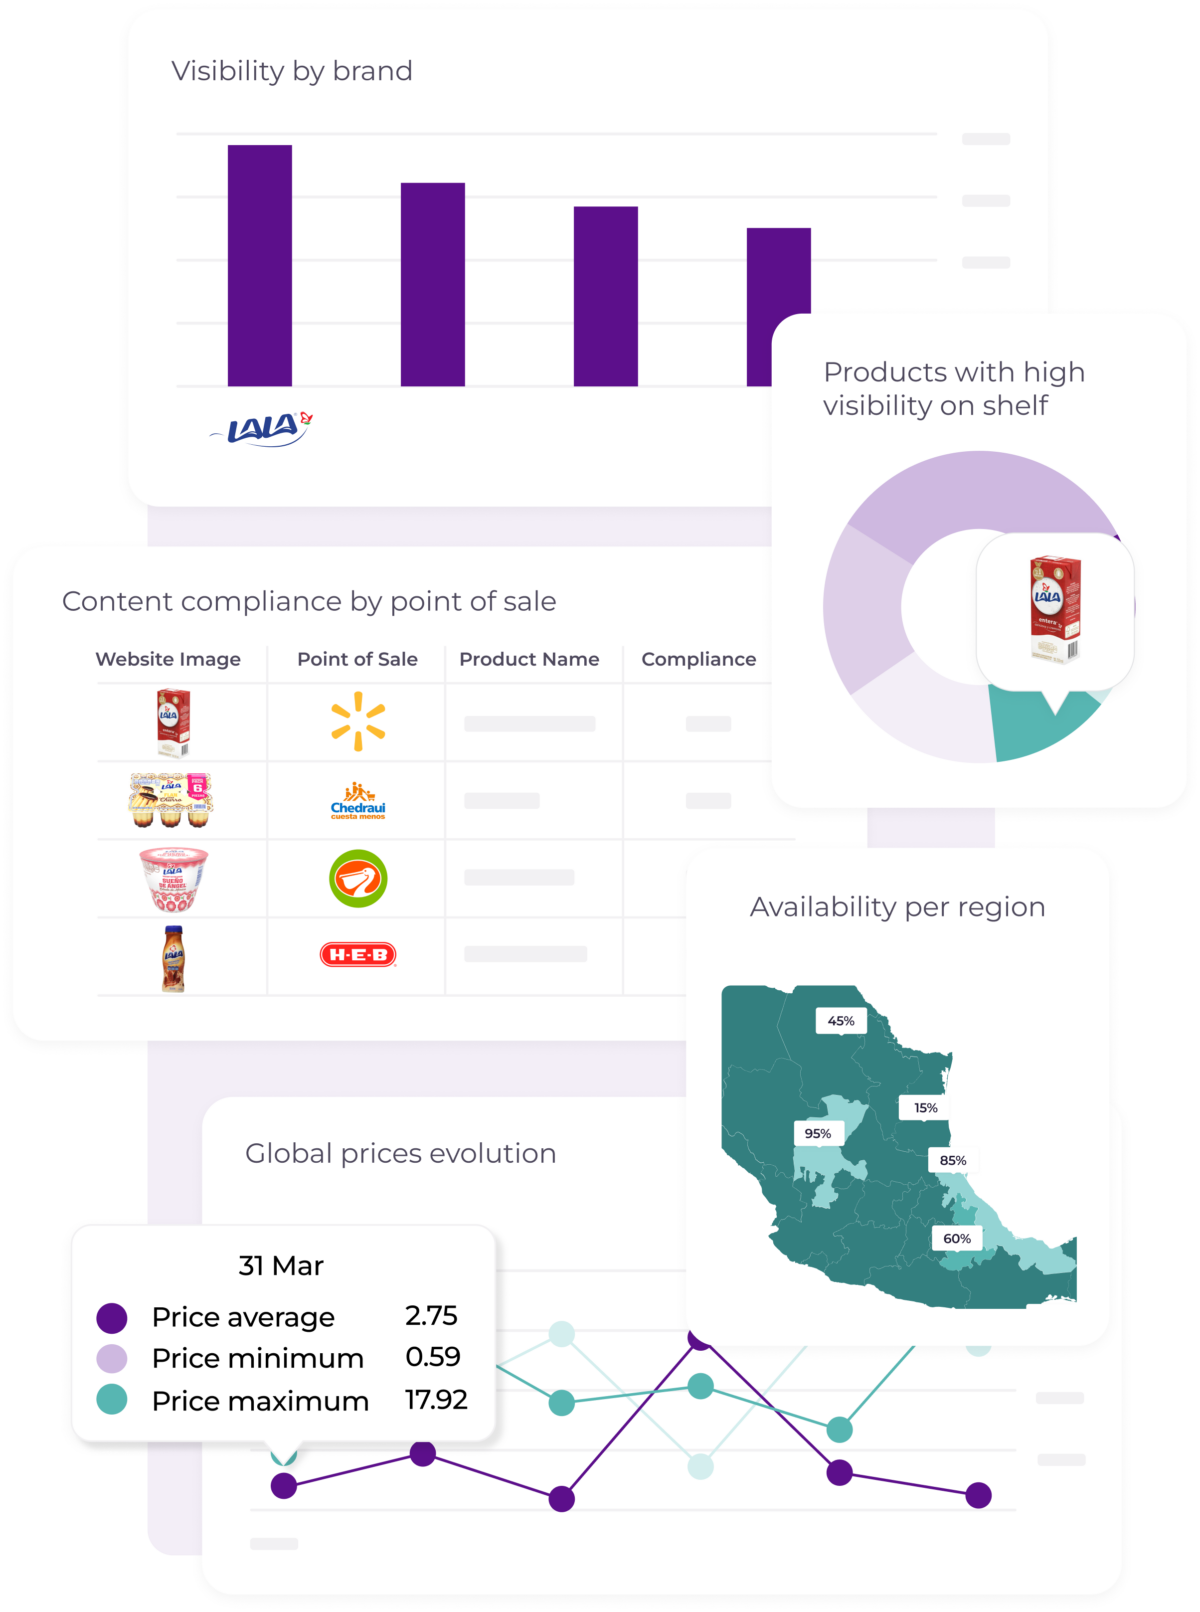
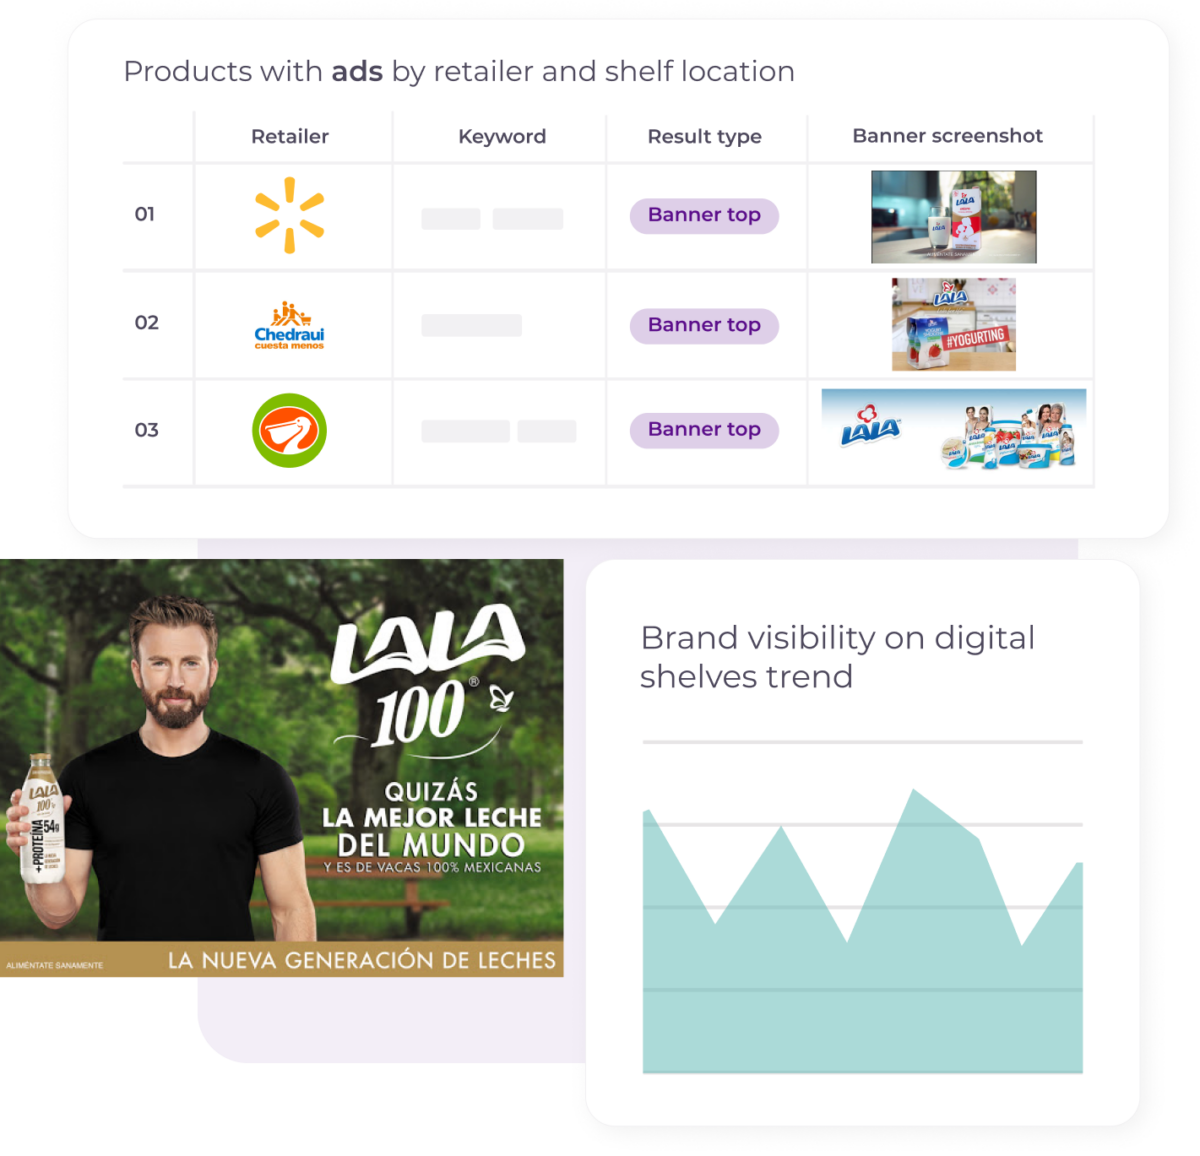
Grupo Lala’s Marketing Department was the first to intelligently leverage the advantages of the product offered by flipflow as a technology partner. By using it to control the visibility and brand presence by keywords in the web search engine results of different retailers, they were able to achieve all these improvements:
- Evaluate the positioning of their brand and products by keywords at shop level.
- Analyse and contrast their Share of Shelf against the competition in each retailer.
- Compare their Paid Share of Shelf vs. that of their competitors, inferring conclusions about competitors’ advertising investments.
- Evaluate the quality of their content in each retailer and be able to enrich it, thus improving their omnichannel image.
- Check the Retail Media campaigns negotiated with their distributors to confirm that their guidelines are correctly applied on a daily basis.
- Analyse on which shelves their products and those of their competitors are presented, drawing conclusions about consumer behaviour based on the Digital Shelf analysis.
Impacted teams:
3. Results
Since Grupo Lala signed its alliance with flipflow, it has experienced notable improvements in many areas of its business. On the one hand, it has managed to have real-time information, with data from the last 24 hours for all its products in all the retailers where it has a presence, something that was simply impossible to achieve with the tool they used before.
They have also achieved greater coverage of their business, as flipflow offers them visibility in retailers such as Sams, Uber Eats, Rappi, Amazon and cash&carry chains,whereas Nielsen PriceTrack does not offer this data. This complete information helps them to negotiate better conditions and improve margins. And, in addition, with this visibility, they obtain complete information about their competitors in the same shops and retailers to implement strategies quickly and effectively.
100%
Price control and promotions real time at shop level
+35%
Retail Media Campaign ROI
3. Results
Since Grupo Lala signed its alliance with flipflow, it has experienced notable improvements in many areas of its business. On the one hand, it has managed to have real-time information, with data from the last 24 hours for all its products in all the retailers where it has a presence, something that was simply impossible to achieve with the tool they used before.
They have also achieved greater coverage of their business, as flipflow offers them visibility in retailers such as Sams, Uber Eats, Rappi, Amazon and cash&carry chains, whereas Nielsen PriceTrack does not offer this data. This complete information helps them to negotiate better conditions and improve margins. And, in addition, with this visibility, they obtain complete information about their competitors in the same shops and retailers to implement strategies quickly and effectively.
100%
Price control and promotions real time at shop level
+35%
Retail Media Campaign ROI
-98%
Expenditure on data analysis
-65%
Expenditure on Store Checks and Market Reports
On the other hand, the savings in time and resources that the use of the flipflow platform has achieved for Grupo Lala is also significant. he execution time for cross-referencing information has been reduced by 98%. For example, the data analysts in the Sales Department used to take around 4 hours a day to cross-reference all the information they had (both proprietary and that obtained from the Nielsen tool they used) to produce their reports. With flipflow, they can get these reports in as little as 2 minutes.
The time spent by Category Managers to understand the competitive situation and performance of their products has also been drastically reduced, from having to wait several days for reports to being able to view them on a single dashboard on the same day. This has enabled unavailable products or new competitor launches to be detected quickly, allowing a much more agile reaction.
The costs for store checks have been reduced by 65%, allowing them to use the amounts that were previously spent on price raids to invest in other areas with a return.
-98%
Expenditure on data analysis
-65%
Expenditure on Store Checks and Market Reports
Finally, it is also worth noting the 26% increase in brand visibility (largely displacing not only private label brands but also Distributor Brands), thanks to the use of flipflow’s platform to carry out an exhaustive control of Digital Shelf and Retail Media in the categories in which they compete in the market and for all the keywords that are key in their sector. This improvement results in higher market share in digital channels but also impacts on physical channels due to consumer behaviour.
All these results and the improvements implemented were bound to result in a 9% increase in sales for Grupo Lala, reaffirming that the idea of implementing flipflow’s market analytics tool was the right decision, and that it is now seen as a global platform for the company.
+26%
Share of Shelf
+9%
Increased Sellout On-Off
Find out how we’re already helping companies like yours
⭐⭐⭐⭐⭐
“Flipflow allows us to react from the sales department and ensure our offer in all channels by having our assortment available and without stock-outs in any postal code in Spain. Its daily use ensures that we don’t lose sales due to stock and assortment shortages.”
“In our case we analyze the products of our categories in 45 retailers in 9 countries to have quality information that we use in competitive manufacturing trends for customers, knowing the average price per gram of many products per country and we also detect potential winner products to add to our offer.”
“We have really noticed the improved control over our recommended prices. Manually it was impossible to maintain a price corridor on so many online channels and that brought us a lot of friction. Now we detect unauthorized sales and sellers on marketplaces that cause us conflicts with our customers.”
“We can analyze our own and competitors’ price movements on a daily basis and have improved our revenue by adjusting prices on a daily basis in terms of pricing and promotional strategy.”
“This is definitely the future of retail. Flipflow gives us an improvement in the quality and structure of the information and considerable savings over traditional market research from well-known consulting firms that sell aggregate data without detail including information we don’t need.”
“Flipflow is core to us in setting prices on a daily basis for more than 60,000 SKUs and maintaining our automatic repricing system in a very competitive industry.”