The intelligent platform that is transforming retail

Analyze the market in real time with our platform. Monitor your distributors and competitors as well as brand positioning and trends. Make strategic decisions thanks to our leading technology to maximize your competitiveness, sales, margins and omnichannel image.

Request demo
A smiling woman with curly hair, wearing a pink shirt and a light gray cardigan, stands in front of an e-commerce analytics dashboard, pointing upwards. The dashboard displays key retail insights, such as 'Best products by attributes' for retailers Zalando, Asos, and Amazon, a 'Buy Box share' metric at 70.63% across 234 sellers, and an 'Availability per region' heatmap for Spain. Various colorful labels highlight topics like 'Disponibilidad y surtido' (Availability and assortment), 'Marketplaces y sellers,' 'Product Insights,' 'Digital Shelf,' 'Retail Media,' and 'Precios y promociones' (Prices and promotions).
A collection of brand logos displayed on a dark purple background. The logos include well-known companies such as MANGO, Unilever, Nestlé, LALA, Hasbro, Motocard, Gucci, Farmacias del Ahorro, AMC Natural Drinks, Tolsa, CCU, and Natura Bissé Barcelona.

Global retail is more competitive than ever, but this transformation is a once-in-a-lifetime opportunity. We can help you make the most of it.

Maximise your sales and market share

Monitoring your competitors and applying strategies based on the best insights.

Avoid conflicts with distributors and sellers

Monitor how they are performing at all times, including the Buy Boxes of marketplaces.

React as fast as the market

Monitoring distributors and competitors globally in real time.

Achieve the best global brand presence

Carrying out the necessary actions to optimise your image and brand position at all points of sale.

Platform

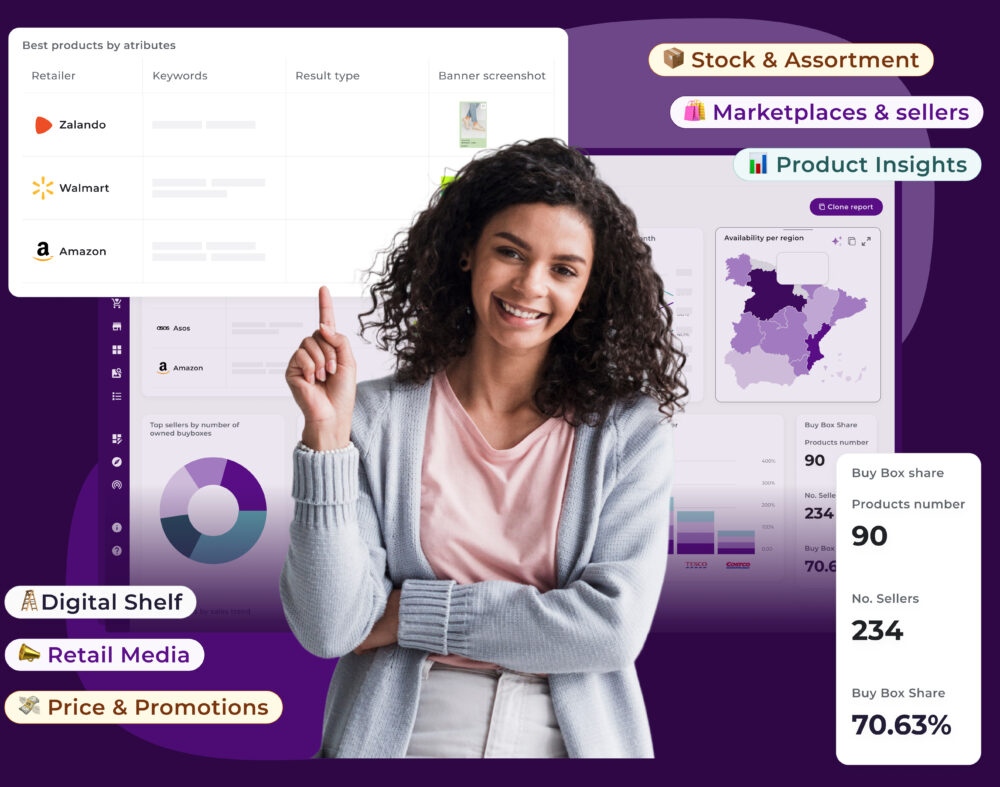
Business Intelligence & AI to analyse the global market in real time

Prices and promotions

Fully control prices and promotions

The right data-driven pricing policy can result in significant variations in sales.

Analyse trends, track records, competitors and monitor distributors in real time to maximise your competitiveness.

Dashboard visualization displaying price and promotion analytics. The top-left chart shows 'Average price evolution per category' with multiple trend lines representing different categories. Below, a stacked bar chart titled 'Promotions distribution by retailer' compares promotional activity across major retailers like Amazon, Walmart, Carrefour, Tesco, and Costco. Additional elements include a 'Time: latest day' filter, a metric showing 'Price discounts: 125' for Amazon, and icons representing pricing and discount analytics.
Dashboard showcasing brand visibility and content compliance. Includes a bar chart 'Visibility by brand' featuring Zara, Mango, Pull&Bear, and Bershka, a donut chart with a 20% metric, and a table for 'Content compliance by point of sale' detailing product listings on platforms like Dia.es and Mercadona.es.

Digital Shelf

Master your positioning on the Digital Shelf

Know your brand presence and visibility in each retailer vs. that of your competitors. Even at store level.

Analyze and optimize product-by-product your share of search, share of voice, your positioning and that of your competitors.

Dashboard showcasing brand visibility and content compliance. Includes a bar chart 'Visibility by brand' featuring Zara, Mango, Pull&Bear, and Bershka, a donut chart with a 20% metric, and a table for 'Content compliance by point of sale' detailing product listings on platforms like Dia.es and Mercadona.es.

Availability and assortment

Maximise stock, assortment and sales at shop level

Stock-outs or lack of assortment at the point of sale can mean millions of sales not generated.

Monitor daily availability, optimise assortments and maximise sellout and sales at shop level.

Dashboard displaying product availability insights. Includes a donut chart for 'Availability by country,' a heatmap for 'Availability per region' showing 70% availability in Spain, and a table listing availability ratios by retailer such as El Corte Inglés, Amazon.es, Nutritienda.com, and Dosfarma.
Dashboard for digital advertising performance. Includes a table of 'Best products by attributes' featuring retailers like Zalando, Asos, and Amazon with banner ad placements. Also includes ranking metrics (3.85 average ranking, best at 1, worst at 62) and a line chart tracking the number of products with ads over time.

Retail Media

Audit and maximise Retail Media ROI

The next wave of advertising will account for 30% of advertising spend in the next 5 years.

Check the ad placements agreed with the sales channels and also analyze the retail media strategies of your competitors.

Dashboard for digital advertising performance. Includes a table of 'Best products by attributes' featuring retailers like Zalando, Asos, and Amazon with banner ad placements. Also includes ranking metrics (3.85 average ranking, best at 1, worst at 62) and a line chart tracking the number of products with ads over time.

Marketplaces

Monitor all marketplaces and sellers

It is estimated that by 2027, 60% of global e-commerce sales will be through marketplaces.

Control sellers and Buy Box changes, positioning, ads, stocks and content. Improve your DTC sales and avoid unauthorised sellers.

Dashboard displaying BuyBox analytics. Includes metrics such as 'BuyBox Share' (70.63%), total products (90), and number of sellers (234). A donut chart shows 'Top sellers by number of owned BuyBoxes,' and a table lists 'BuyBoxes not owned' for retailers such as Walmart and Tesco. Additionally, a 'Best Seller' section highlights an Amazon product in stock.
Dashboard tracking product sales trends. Includes a table of 'Top products by sales trend,' listing retailers such as Carrefour, Amazon.es, Tesco, and Walmart. Additional visualizations include a donut chart for 'Visibility by brand on period' and a line chart for 'Price evolution by retailer.

Market analytics

Get accurate, real-time market reports

Flipflow allows you to have higher quality information, exactly as you need it, without non-transparent aggregates, actionable and on a daily basis.

All this at a much lower cost than traditional market research.

Dashboard tracking product sales trends. Includes a table of 'Top products by sales trend,' listing retailers such as Carrefour, Amazon.es, Tesco, and Walmart. Additional visualizations include a donut chart for 'Visibility by brand on period' and a line chart for 'Price evolution by retailer.

Our solutions will help you to:

Increase market share

Optimise brand presence

Maximise competitiveness

Avoid channel conflicts and unauthorised sellers

Strengthen an omni-channel position

Reduce investment in market reports

Maximise Retail Media ROI

Bring all your teams together on a single platform

Success Stories

Transform your decision-making as others have already done:

Image with the Unilever logo and the text "Controlling the brand image throughout Europe and optimizing sales"
Woman smiling with orange juice, with the text "Monitor the vegetable beverage market in multiple countries in real time." The categories "Retail," "Food," and "FMCG"
More success stories
A young woman with curly red hair, wearing a denim jacket and a colorful headband, sits on the floor in a cozy living room, working on an orange laptop placed on a wooden coffee table. The room features a teal sofa with decorative pillows and an orange throw blanket. Green plants add a natural touch to the space. Overlaying the image is the text 'The RETAIL 360 NEWSLETTER' in bold, modern typography.

Subscribe to our newsletter

Don’t miss out!

Join our community and receive content about the retail world every week.

Comillas

They say
about us

Estrellas

“Flipflow allows us to react from the sales department and ensure our offer in all channels by having our assortment available and without stock-outs in any postal code in Spain. Its daily use ensures that we don’t lose sales due to stock and assortment shortages.”

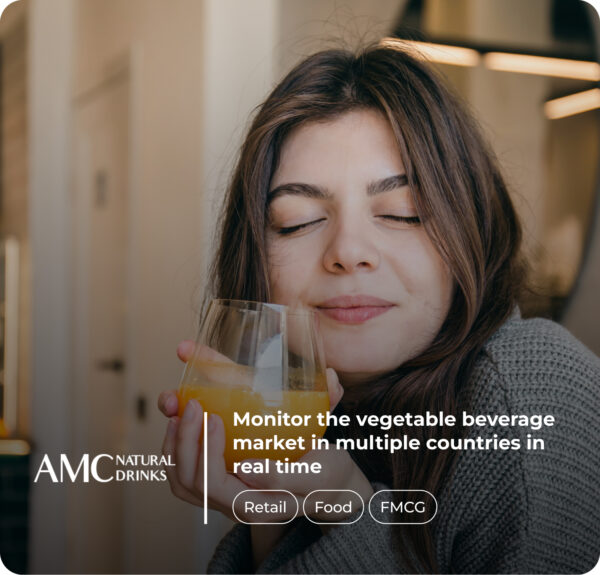
“In our case we analyze the products of our categories in 45 retailers in 9 countries to have quality information that we use in competitive manufacturing trends for customers, knowing the average price per gram of many products per country and we also detect potential winner products to add to our offer”.

“We have really noticed the improved control over our recommended prices. Manually it was impossible to maintain a price corridor on so many online channels and that brought us a lot of friction. Now we detect unauthorized sales and sellers on marketplaces that cause us conflicts with our customers.”

“We can analyze our own and competitors’ price movements on a daily basis and have improved our revenue by adjusting prices on a daily basis in terms of pricing and promotional strategy.”

‘This is definitely the future of retail. Flipflow gives us an improvement in the quality and structure of the information and considerable savings over traditional market research from well-known consultancies that sell aggregate data without detail including information that we don’t need.”

“Flipflow is core to us in setting prices on a daily basis for more than 60,000 SKUs and maintaining our automatic repricing system in a very competitive industry.”

Implementation & support

It’s okay if you don’t have it all under control.
We will help you.

  • Implementation in a few weeks and without the need to involve your technical team.
  • Onboarding sessions with dedicated Account Manager to get Flipflow configured to your needs.

  • Always attentive support from your Account Manager in case of doubts and questions.
Customer succes
Request demo